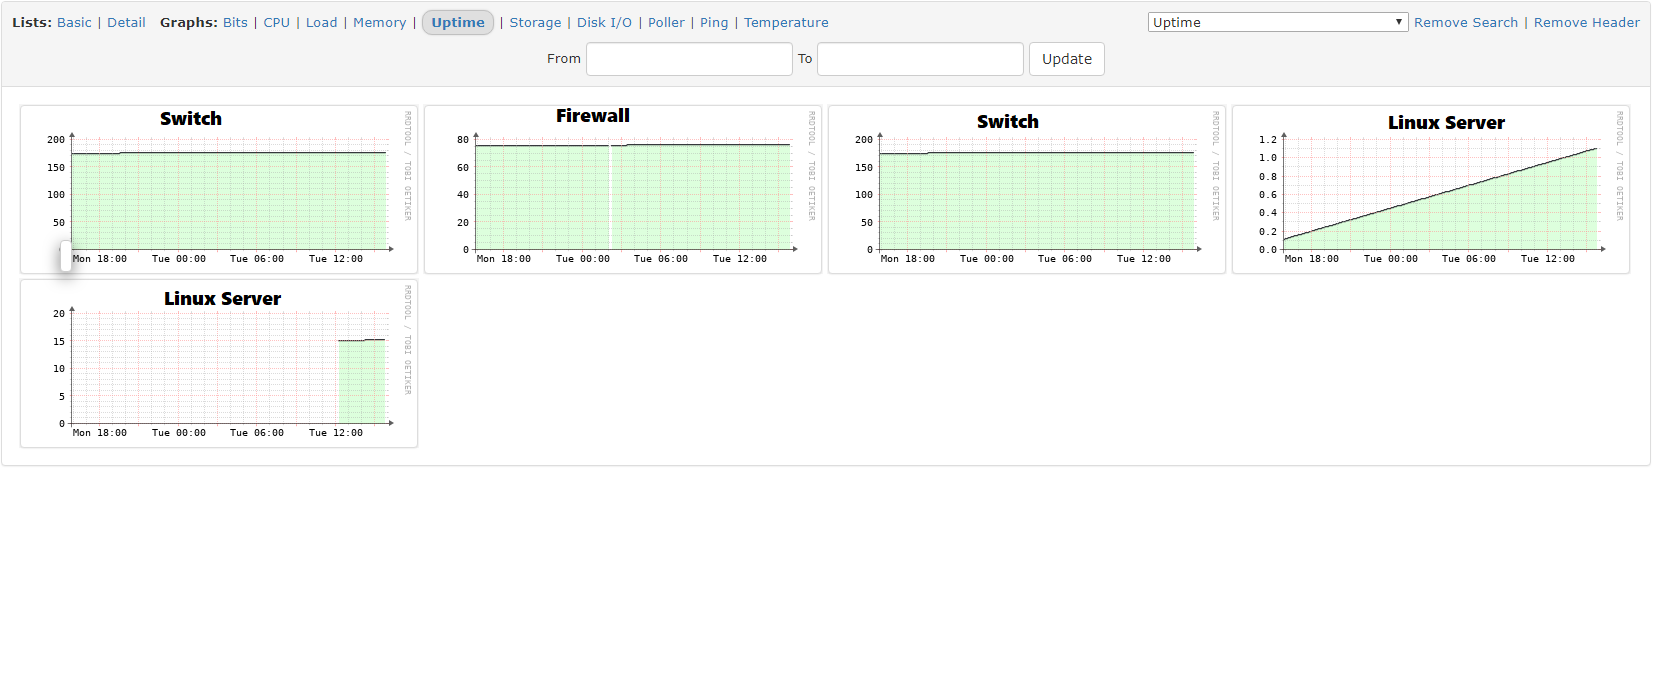
Hello, I’m looking for a way to show the graphs for all device uptimes within one page. Right now, when I select Devices > All Devices > Graphs, only 5 devices are shown of the 40+ devices i’ve added onto LibreNMS.
Right now, of the 40+ devices i’ve added onto LibreNMS, only 5 devices are showing which are my linux servers, two odd switches, and my firewall. All of my windows servers and most of my switches are not shown in this view. Is there something i’m missing that allows a device to be shown in this view
All my devices are graphing properly and the uptime shows on the individual device level. Validate showed all OK’s.