gonzo
29 April 2021 08:08
1
Hello,
I’ve mange to get LibreNMS attached to Grafana as I need to display a table showing CPU, Physical Mem, Virtual Mem, Storage, Network.
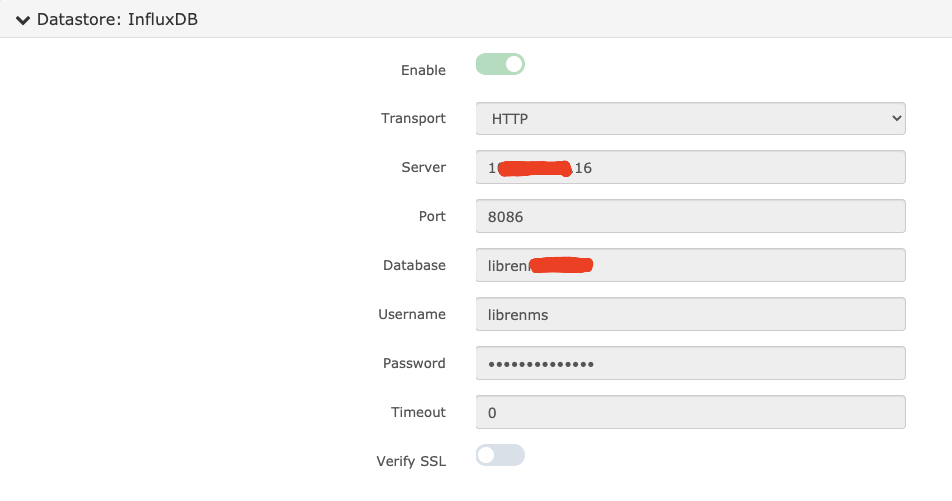
Here are my settings:
The problem I am getting is I can only see the Virtual memory which is seen as ‘Mempool’, I can’t find anything for the Physical Memory.
Can I do this at all and if so how?
These devices are just Windows 10 machines we need to monitor.
Thanks
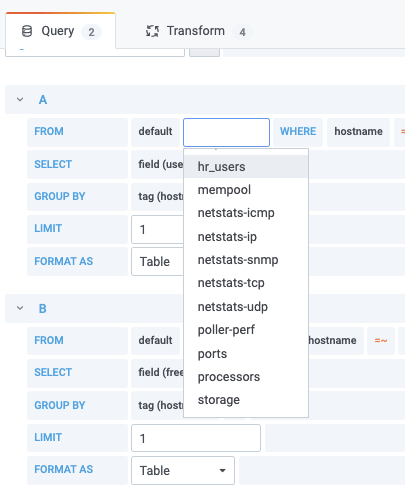
@G0nz0uk Each mempool should have a single datapoint, but you should have multiple for each type. Perhaps you aren’t looking at the correct thing in Grafana.
Hi Murrant, yes upgrading to the latest version fixed this.
Do you know what hostname might come under?
system
8 May 2021 11:14
4
This topic was automatically closed 7 days after the last reply. New replies are no longer allowed.