LibreNMS team & fans:
I’m a sysadmin who spent a good number of years working for a non-profit research organization. When I took another job, I found myself dealing with more and more network-related stuff and consulted with a colleague from the non-profit who specialized in network stuff. He suggested I setup an instance of Observium…which did in late 2018. I’m not much of a *Nix guy but I’m learning.
Anyhow, fast-forward to this past Friday – I had a bit of spare time on my calendar and I know that my observium build had some problems and I thought now would be a great time to investigate LibreNMS. First off, I find it to be much more visually appealing than Observium. I only have a few devices in it now while I evaluate (and get everything working) but I do anticipate retiring observium and moving to Libre.
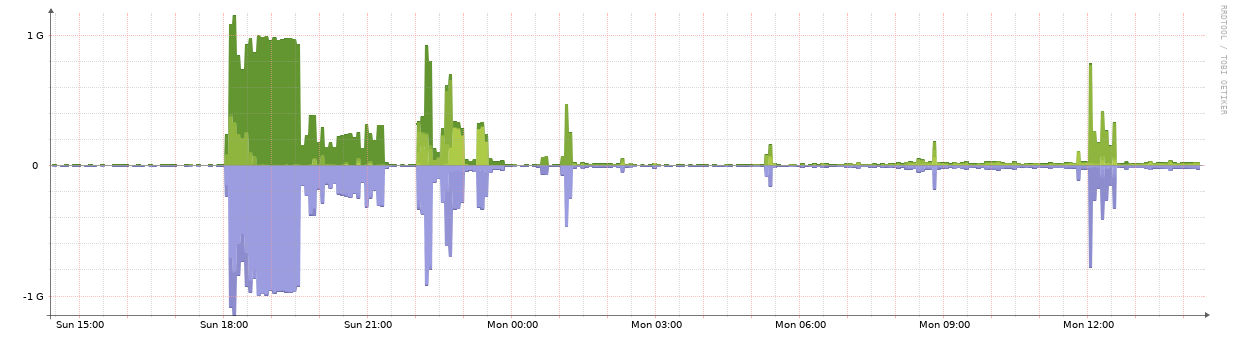
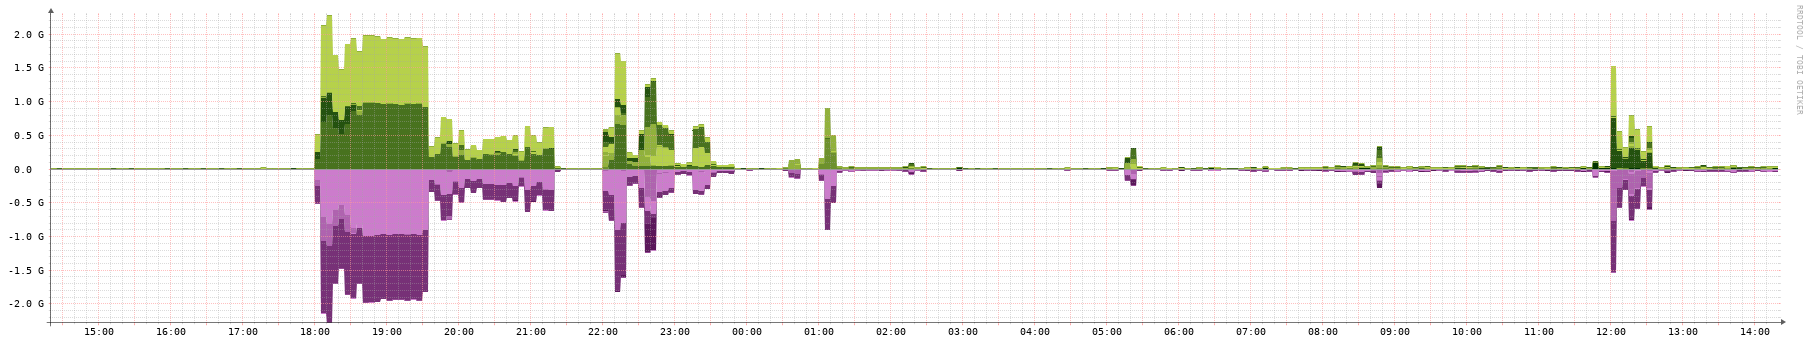
Now…here’s something particularly interesting: I was looking at traffic on our main switch in observium and libre and the traffic pattern looks the same but the amount of data according to observium is about 50% less than what libre is saying it is. I’ll have to do some more digging, but I find this to be extremely interesting either way.
Also - thank you to the libre team because there are definitely some nice differences here that make it more appealing than Observium.