You can configure the alerting of librenms with the alerts you want, including a lot of templates, then configure your Dashboard with the alerting widget.
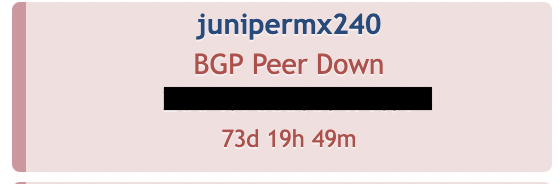
Yeah, I already use the alerts widget but it doesn’t present information clearly like Observium does like shown in the github issue, I have to drill down (partially by using the + icon) into the alerts to actually see what has happened. Example picture below of a BGP session that is down and all detail is shown on the dashboard (session IP is blocked out), this is repeated for all downed sessions, same for a downed interface port too (which eventually disappears from the dashboard automatically).