I have one device that just will not cooperate. I have deleted it and re-added. The same outcome occurs, with just this one single device. It is the only one I have seen this on and I have expensed the limits of my current knowledge on this trying to figure out how to overcome. This is on a Calix E7 w/ VDSL shelf, have a bunch of other of them and have never had this happen. It only happens on this one box.
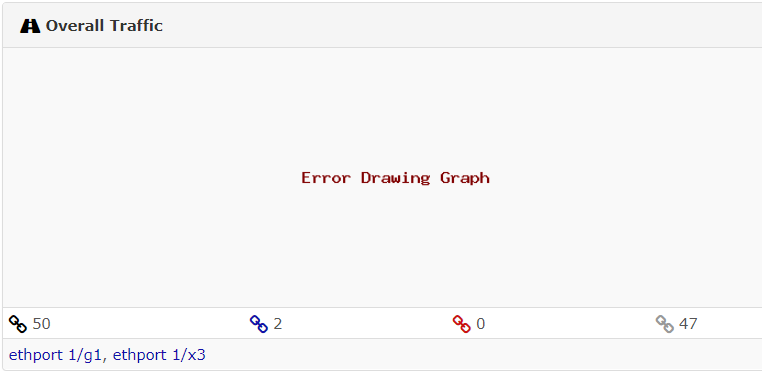
My overall traffic graph for this device will only appear if I have a specific DSL port polled, and the overall traffic graph will only show that one DSL port, even though the other ports that I want shown are listed in the legend.
Has anybody ever seen anything similar or can shed light? Also - when I said turn off polling on the device, what I meant to say is turn off polling that single DSL port 1/v2.
Can you see the other port stats when you click on them ? It seems that for some reason the other ports are not polled and/or the polled data are not written in the RRD. So aggregation only occurs on the DSL data, and of course if you remove it, no data is left.
Yes, I am able to see the other ports individually fine. It is a real head scratcher. I have the poller and discovery set per OS so all of my exa devices are being discovered and polled the same and it is the only one doing this. I thought deleting the device and re-adding it would clear it up, unless there is something that is not obvious residually hanging around even after deleting the device in the interface that could be hosing things up.