Packet loss seems to cause absurd spikes in graphs

Steps to reproduce an issue:

  • Have packet loss to a site
  • Check interface throughput graphs.

It’s pretty easy to see here - this switch has CCTV cameras on it and usually has a steady ~200Mbps of traffic on it. As soon as there is packet loss, the stats turn to garbage, then return to normality once the packet loss clears.
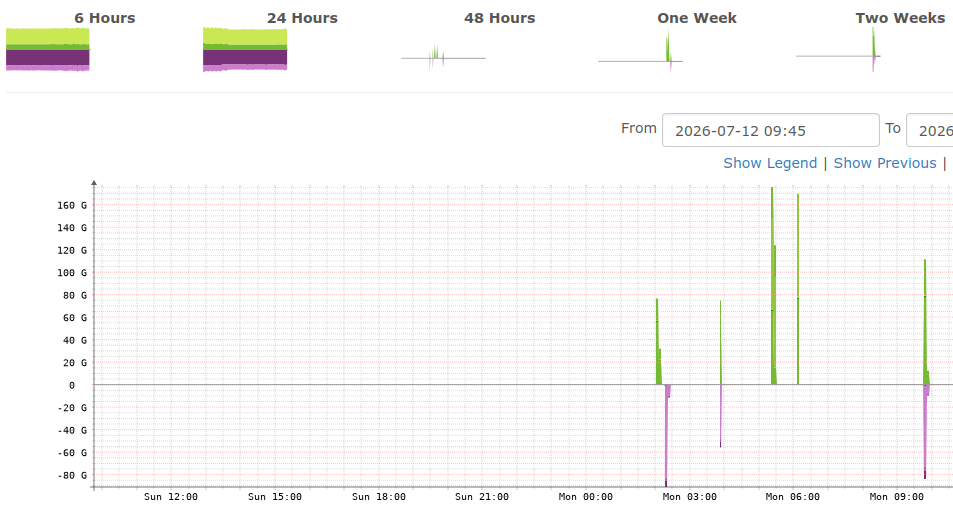
What is happening here? Miss a poll and the counter is assumed to be 0, therefore it overflowed, therefore there was a huge spike in traffic?

  • The output of ./validate.php
librenms:/opt/librenms$ ./validate.php 
===========================================
Component | Version
--------- | -------
LibreNMS  | 26.6.1 (2026-06-18T08:10:36+01:00)
DB Schema | 2026_06_09_000000_change_vsz_to_big_int_processes_table (390)
PHP       | 8.4.21
Python    | 3.12.13
Database  | MariaDB 10.11.18-MariaDB-ubu2204
RRDTool   | 1.9.0
SNMP      | 5.9.5.2
===========================================

[OK]    Installed from package; no Composer required
[OK]    Database Connected
[OK]    Database Schema is current
[OK]    SQL Server meets minimum requirements
[OK]    lower_case_table_names is enabled
[OK]    MySQL engine is optimal
[OK]    Database and column collations are correct
[OK]    Database schema correct
[OK]    MySQL and PHP time match
[OK]    Active pollers found
[OK]    Dispatcher Service is enabled
[OK]    Locks are functional
[OK]    No python wrapper pollers found
[OK]    Redis is functional
[OK]    rrd_dir is writable
[OK]    rrdtool version ok
[WARN]  Non-git install, updates are manual or from package

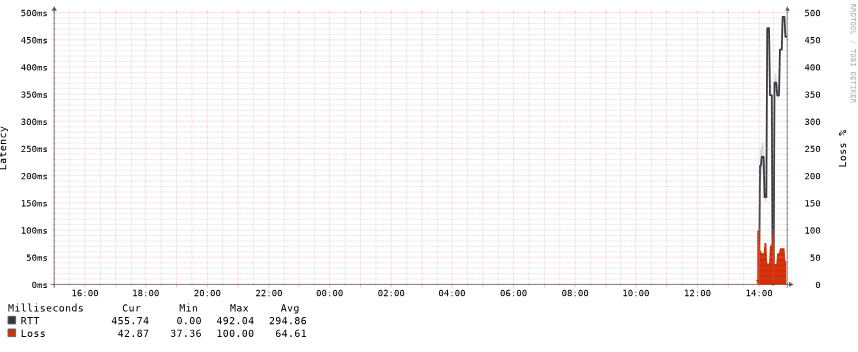
If you’re seeing that regularly enough on a single port that you can grab some debug data then do:

lnms config:set debug_port_<PORT_ID>

Obviously replace <PORT_ID> with the id of the port which you can usually get from the url.

Run it for a bit and then post the output of the file along with a screenshot of the increase and your timezone.

OK…my problem here is going to be finding a site with regular enough packet loss to cause the issue :smiley:

Issue has definitely been there for some time though, I had always assumed it was poor counter wrapping handling, but I know at this site we had a WAN issue and it affected every polled device.

Fyi there is also a tool to remove the spikes. So at least the rest of the data is usable. If you can catch it doing it in debug that would be amazing.

This issue seems to be more complex than just “packet loss”. I have added a 4G router I know to be a bit lossy and I have not seen any weird spikes in the interface graphs.

This may be a 32bit overflow of the counter. have ifHCInOctetsand ifHCOutOctets is avaible Librenms will use 64bit, else its 32bit, and at ~3min

2^32 Octetes × 8 / 200 000 000 bit/s ≈ 171,8 s

It’s a good shout but how can I tell if any given port is polling 64 or 32-bit counters? The targets [Aruba and Unifi] definitely support ifXTable.

My other suspicion is that it is a partial snmp response from the device. Which is why I would love to get a debug of a poll when this happens, but no one has ever been able to deliver that.