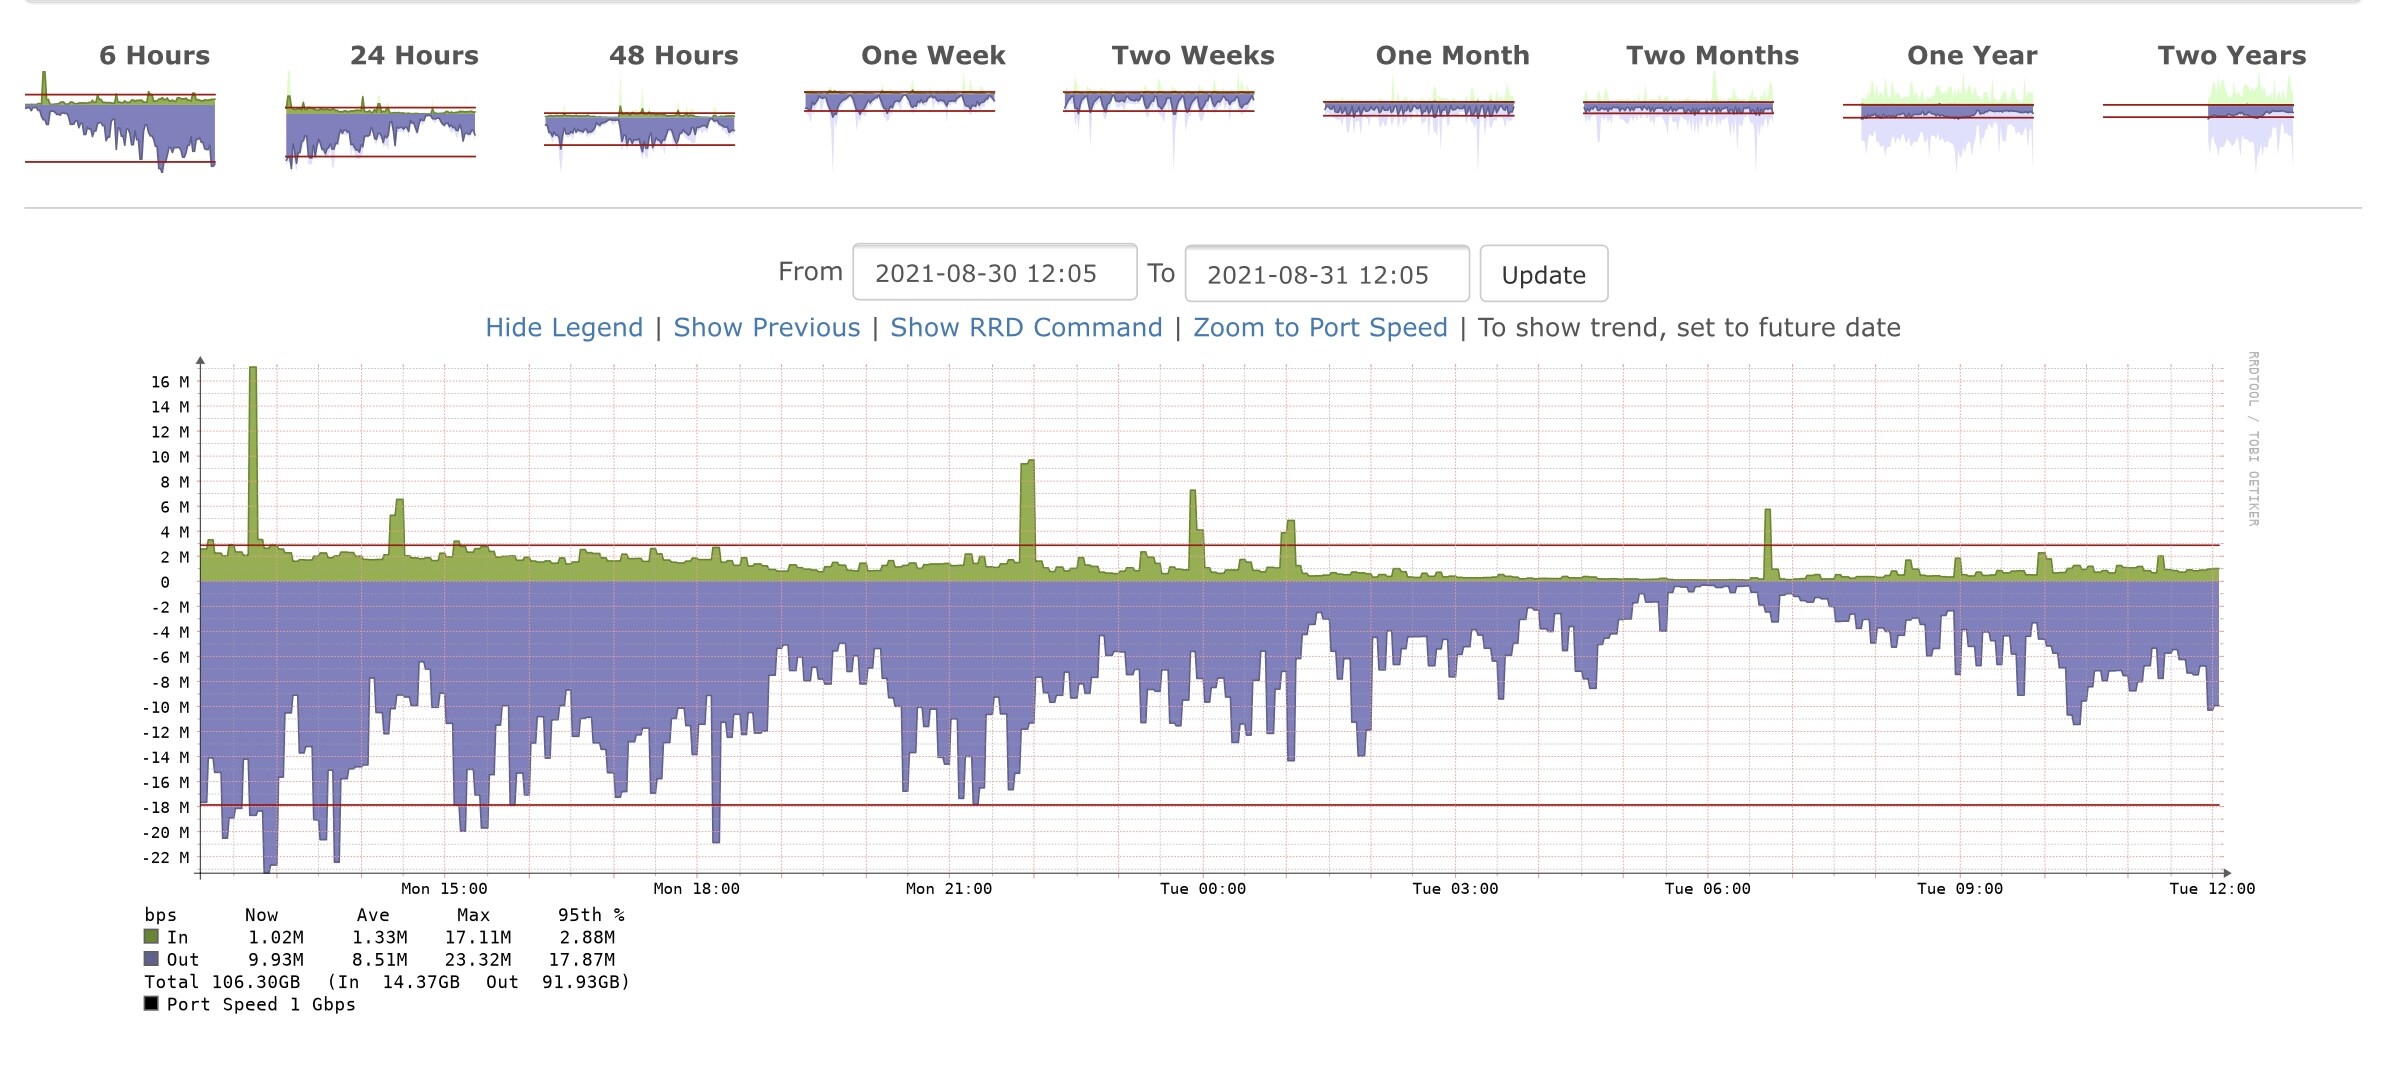
Sorry for asking help. Is there any way to extract the info as per graph above?
For example, on one week period graph, with extract button and convert the details on bandwidth summary per port into csv/xlsx file. Maybe the detail require to extract are Port Description, Bandwidth Now, Bandwidth Average, Bandwidth Maximum and 95% Percentile.
Hello,
There is alot tools which converts RRD files to other formats and also csv, so you can use the one that suits your needs, like rrddump or rrdxport which dumps rrd data into xml.
However, I am prefer if there is a button which can extract those data. Since LibreNMS can create user account under normal which is not Administrator. Specifically for customer/client whose can’t access directly to LibreNMS server.
It may be difficult every time client require the data and IT Admin need to access the server in order to create data by using rrdxport or rrddump.
I am currently work with the provider, it would be beautiful if LibreNMS have this feature. Since most of the user require to provide a bandwidth report before they upgrade the bandwidth with the provider.
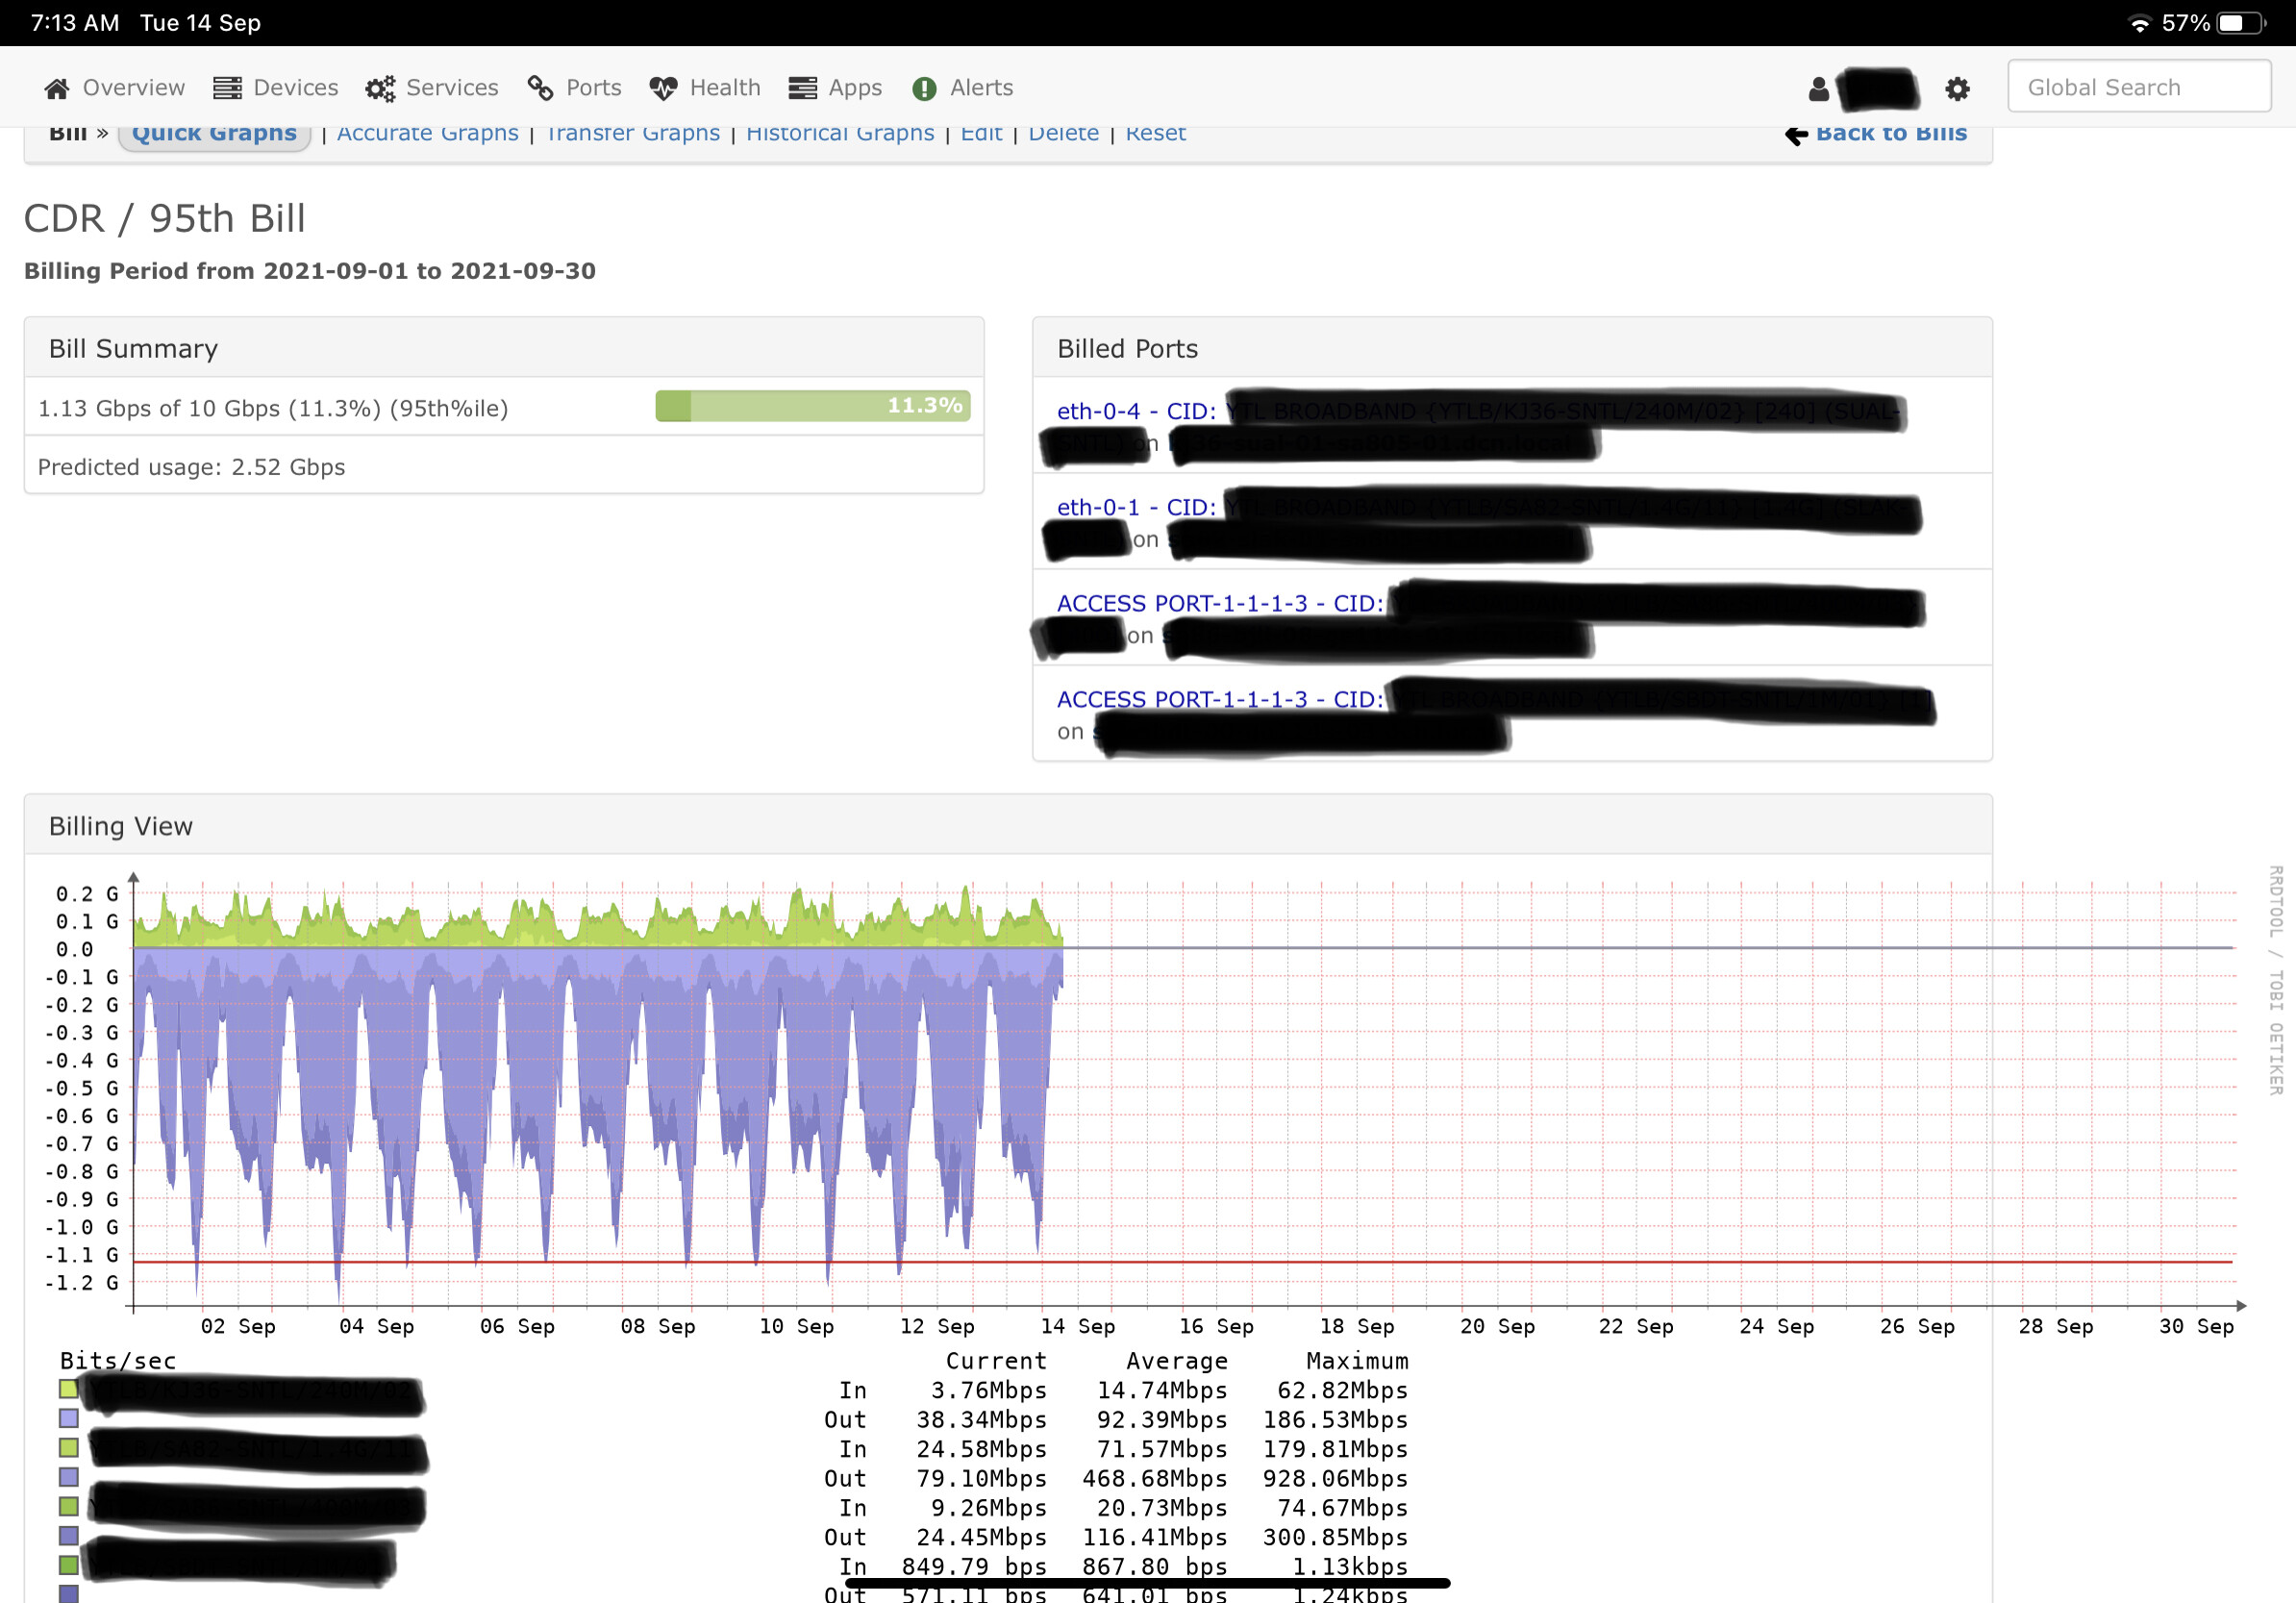
Then I don’t quite undestand your feature request idea, if just convert rrd to digits thats possible with external tools, if you need interface report check billing module
For example, I have Customer A with multiple port or Service ID.
For some reason, Customer A require to extract specific port to csv/pdf which it cannot be done due to the billing module only display all ports summary bandwidth usage.
Maybe we need to improve the billing module which can extract to the csv/pdf which Customer A can select which ports/Service ID they require.
Try easiest one curl -X GET ... | jq -r '.. | @csv' then you can replicate this with any programming language of your choice to do more beautiful things.