Hi,
I’m using InfluxDB together with Grafana. Everything from LibreNMS gets pushed into Influx just fine, besides Pi-hole stats:
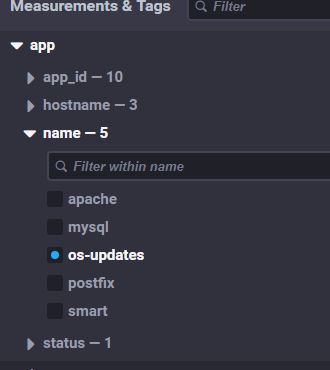
My LibreNMS Database in Inlfux:
Has anyone got this working or could that be a Bug?
Greets
Daniel
Hi,
I’m using InfluxDB together with Grafana. Everything from LibreNMS gets pushed into Influx just fine, besides Pi-hole stats:
My LibreNMS Database in Inlfux:
Has anyone got this working or could that be a Bug?
Greets
Daniel
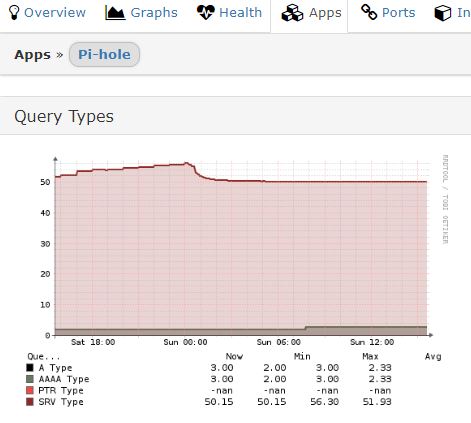
App’s inside LibreNMS, Pi-hole is shown and generates Graphs:
Droped the database to let LibreNMS regenerate it, still no luck.
It looks like the currently pi-hole app extension was built for pi-hole’s older v2 API. Even the query data in the RRD graphs doesn’t seem right. It seems unlikely that your # of A and AAAA queries would match exactly and both be significantly lower than SRV queries.
I’ll see if there’s anything I can do but it may take time as it will probably require PR’s to both librenms itself and the agent.
A and AAA do match exactly, that’s correct due to the fact that pi-hole is not in production use at the moment and only used by the RPi itself hosting pi-hole:
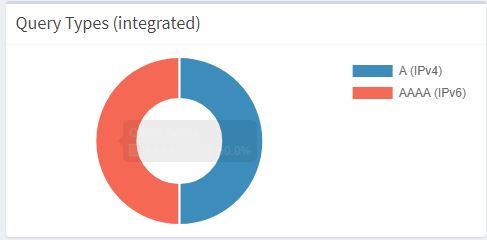
On my pi-hole, that pie chart shows the query types as a % and that % matches what’s in the pi-hole API that the app plugin polls from. So I would still have expected the LibreNMS to chart that as 50.00% A and 50.00% AAAA if they match.
You might try checking the output of ./poller.php -h HOSTNAME -r -d -v -m applications (run as your librenms user against the pi-hole). Usually errors for InfluxDB show up as a HTTP 400 error in the output.
The percentage is only shown when mouse is hovered over the pie chart. Which Version do you use? I use v3.3.1.
There we go:
Caught exception: HTTP Code 400 {"error":"unable to parse 'app,hostname=cybrasp-ke,name=pi-hole,app_id=15 domains_blocked=122106,dns_query=14843,ads_blocked=10,ads_percentage=0.067372,unique_domains=35,queries_forwarded=4688,queries_cached=10145,query_a=3,query_aaaa=3,query_ptr=\"\\enabled\\\",query_srv=50.02': unbalanced quotes"}
Thats what the Pi-hole bash file outputs:
122106
15049
18
0.119609
45
4784
10247
3
3
"enabled"
50.05
49.95v3.2.1 here. Problem looks the same though. You can see it there, it’s putting the status=“enabled” value into your query_ptr. And the client count values into your query_a and query_aaaa counts.
Yep, I see.