Hi guys , Im watching some strange behaviour regarding ping rtt and latency tab.
Lests check , the device 172.30.10.3 wich is wired and 1 hop from lnms.
Checking ping from librenms cli I have:
[root@monitoreo ~]# ping 172.30.10.3 -c 10
PING 172.30.10.3 (172.30.10.3) 56(84) bytes of data.
64 bytes from 172.30.10.3: icmp_seq=1 ttl=62 time=1.26 ms
64 bytes from 172.30.10.3: icmp_seq=2 ttl=62 time=1.53 ms
64 bytes from 172.30.10.3: icmp_seq=3 ttl=62 time=1.35 ms
64 bytes from 172.30.10.3: icmp_seq=4 ttl=62 time=1.36 ms
64 bytes from 172.30.10.3: icmp_seq=5 ttl=62 time=1.44 ms
64 bytes from 172.30.10.3: icmp_seq=6 ttl=62 time=1.48 ms
64 bytes from 172.30.10.3: icmp_seq=7 ttl=62 time=1.35 ms
64 bytes from 172.30.10.3: icmp_seq=8 ttl=62 time=1.28 ms
64 bytes from 172.30.10.3: icmp_seq=9 ttl=62 time=1.39 ms
64 bytes from 172.30.10.3: icmp_seq=10 ttl=62 time=1.32 ms

--- 172.30.10.3 ping statistics ---
10 packets transmitted, 10 received, 0% packet loss, time 9014ms
rtt min/avg/max/mdev = 1.269/1.380/1.531/0.082 ms
Avg is about 1.3 ms, wich is normal value in wired networks.
Smokeping running in same server than lnms provides similar values:
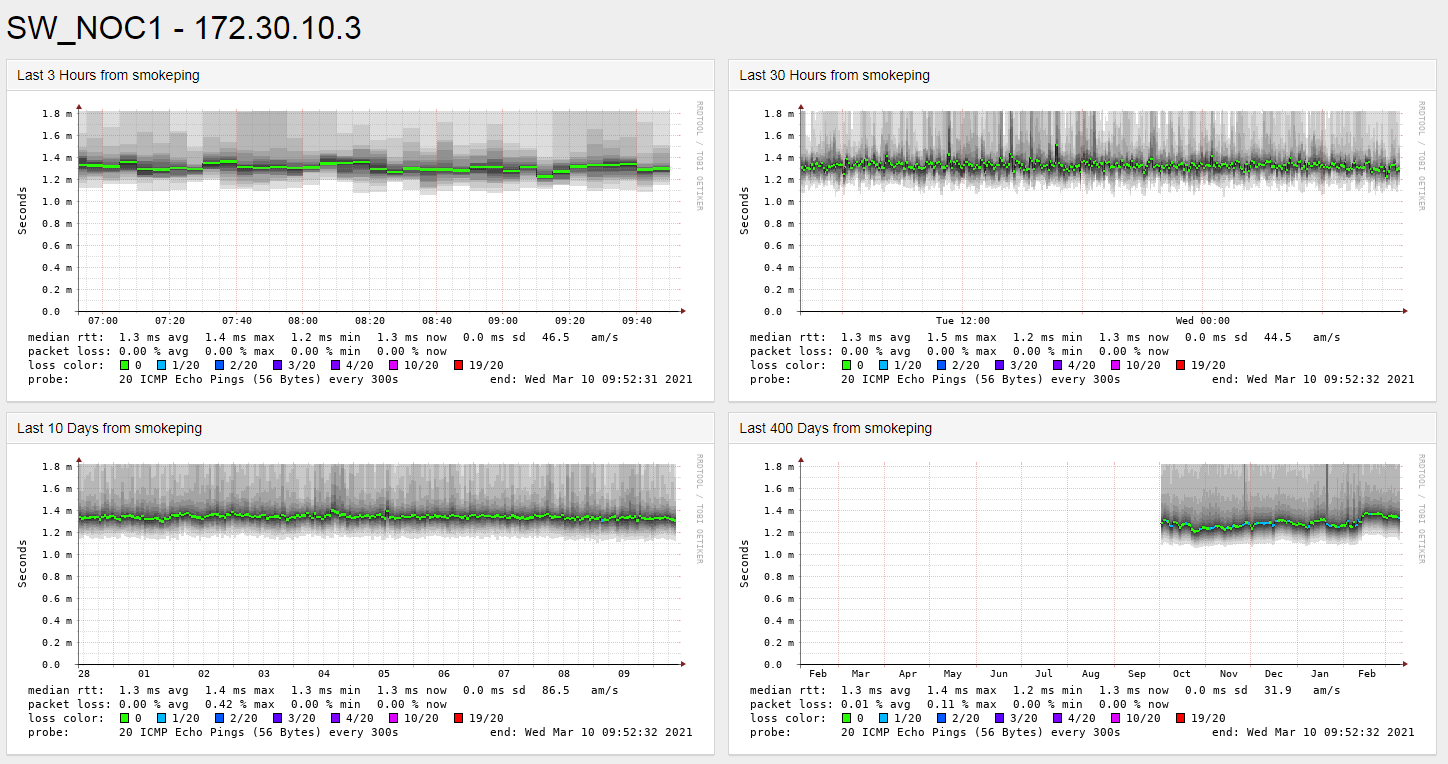
But…
Then, If I go to graph → poller → ping response , I have:
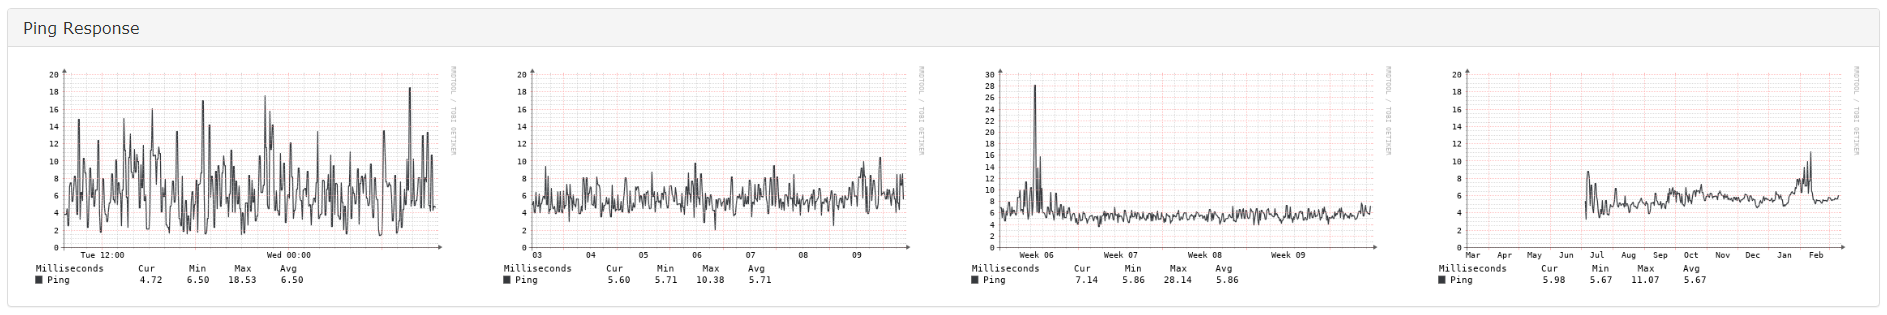
Also in latency tab:
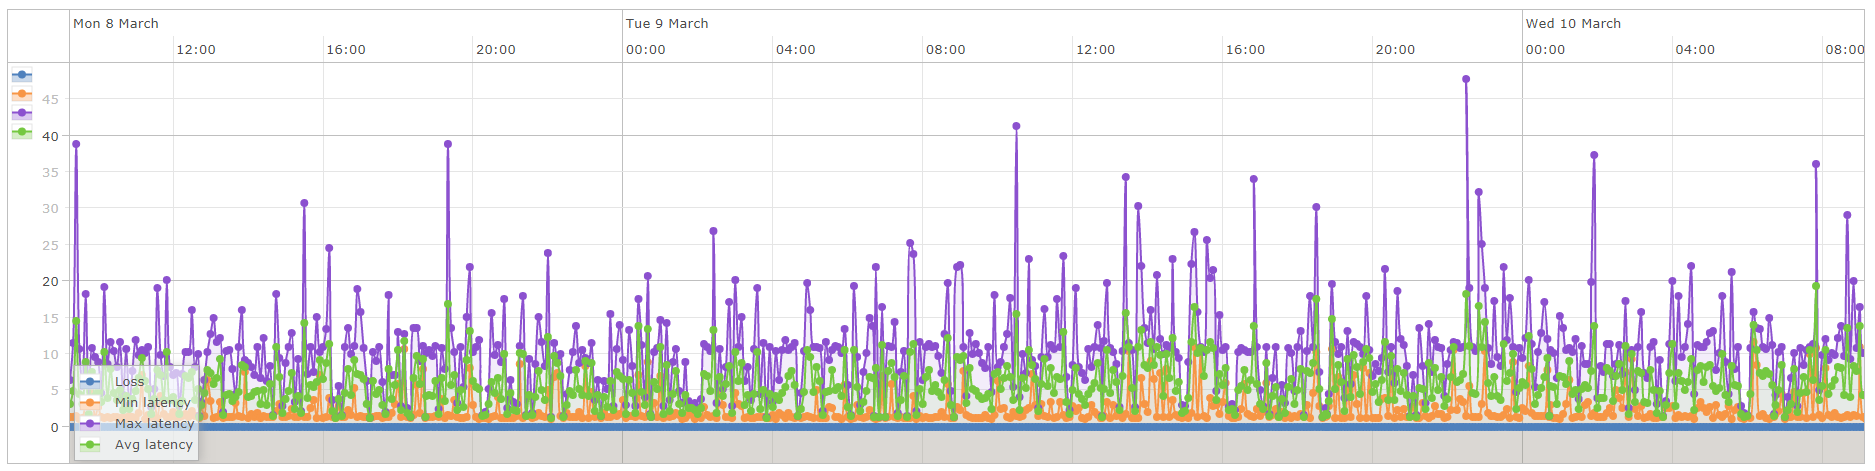
AS you can see on both images there is a very high average value and very high jitter on the graph.
both results are very differents to command line ping result and smokeping.
Since those very big differences I can not use alert notifications from lnms.
I created an alert if latency goes above 5 ms , but Im having a lot of false alerts.
So …
Is there some explanation about this?
Is there some way to fix latency graphs ?
I would like to avoid using nagios ping_check plugin.
Regards.
Leandro.