Hi,
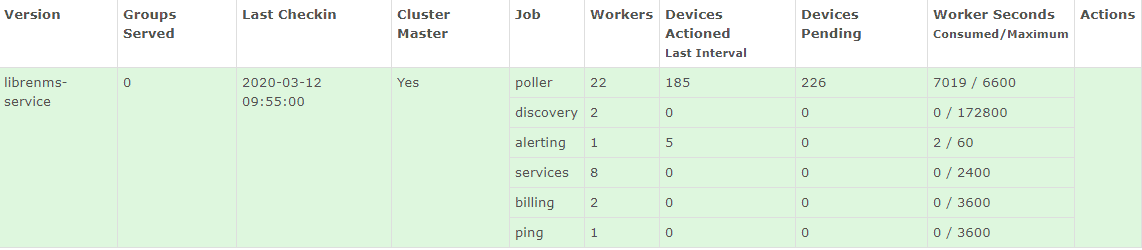
I have a single-box setup monitoring 410 devices and 20k+ ports. CPU utilization was a bit on the high side, specially during discovery cycles, so I asked the VMware team to add 8 additional CPUs to the VM (24 now in total). They did that, but after rebooting the VM, the graphs stopped being plotted and CPU was actually higher. To get some graph data back, I have to reduce the number of workers to 12 (was 20 before the CPU addition), but then the polling cycle is not complete in time.
Has anyone faced anything similar?
./daily.sh Updating to latest codebase OK Updating Composer packages OK Updated from e5dad7a to 746112a OK Updating SQL-Schema OK Updating submodules OK Cleaning up DB OK Fetching notifications OK Caching PeeringDB data OK
./validate.php
sh: line 1: 26558 Killed sudo -K > /dev/null 2>&1
sh: line 1: 26631 Killed sudo -K > /dev/null 2>&1
sh: line 1: 26691 Killed sudo -K > /dev/null 2>&1
====================================
Component | Version
--------- | -------
LibreNMS | 1.61-30-g746112a
DB Schema | 2020_02_10_223323_create_alert_location_map_table (159)
PHP | 7.2.27
MySQL | 10.4.12-MariaDB
RRDTool | 1.7.2
SNMP | NET-SNMP 5.7.2
====================================
[OK]    Composer Version: 1.10.0
[OK]    Dependencies up-to-date.
[OK]    Database connection successful
[OK]    Database schema correct
[WARN]  Some devices have not been polled in the last 5 minutes. You may have performance issues.
        [FIX]:
        Check your poll log and see: http://docs.librenms.org/Support/Performance/
        Devices:
          and 200 more...
[WARN]  IPv6 is disabled on your server, you will not be able to add IPv6 devices.