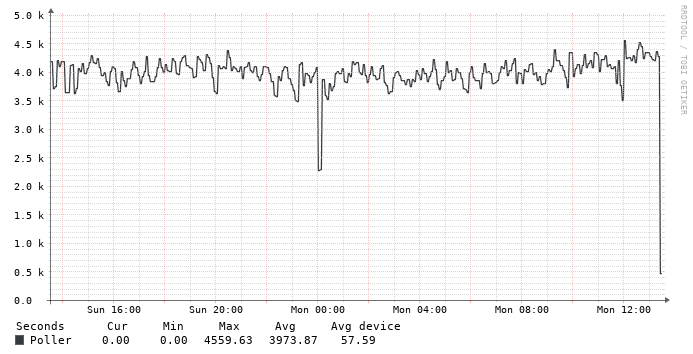
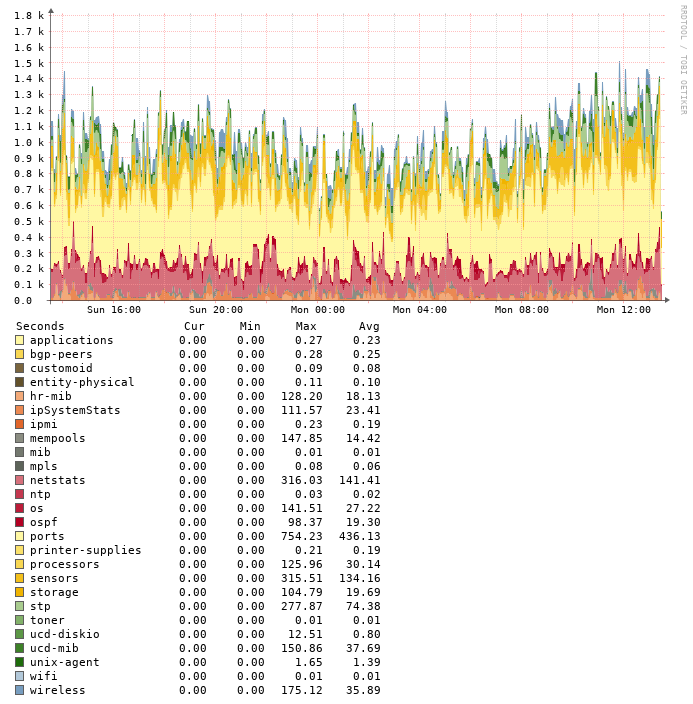
I’m experiencing something that looks like halts in the polling at certain intervals. In the graphs it looks like at 00:00 the poller halts for a few minutes leaving a vertical gap in some of the graphs.
- This happens very day
- A large portion of the devices are affected
- Not the same devices every time
- The devices were not rebooted
- They were not flagged as down thus creating an entry in the notification log
- I have no reason to believe that underlaying network errors occur. Devices on the same net are affected, with some showing a gap in their graph, while neighbouring devices does not
- The devices are servers, networking equipment, UPS’s, PDU’s, environment sensors and more. They are affected equally
- There are no cron jobs running at 00:00 on the librenms box.
./discovery.php -h HOSTNAME -d → https://p.libren.ms/view/9da70b0d
./poller.php -h HOSTNAME -r -f -d → https://p.libren.ms/view/addbdabb
librenms@librenms:~$ ./validate.php
| Component | Version |
|---|---|
| LibreNMS | 21.4.0-30-g317705254 |
| DB Schema | 2021_04_08_151101_add_foreign_keys_to_port_group_port_table (208) |
| PHP | 7.4.3 |
| Python | 3.8.5 |
| MySQL | 10.3.25-MariaDB-0ubuntu0.20.04.1 |
| RRDTool | 1.7.2 |
| SNMP | NET-SNMP 5.8 |
| ==================================== |
[OK] Composer Version: 2.0.12
[OK] Dependencies up-to-date.
[OK] Database connection successful
[OK] Database schema correct
Example:
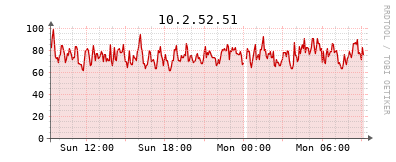
There are more examples, but tue to conspicuous names embedded in the images i start with this.