Hi,
I am receiving an error when the Poller-Wrapper runs via a cron job. Its not every time cron runs but at least a couple times an hour. The email say
Cronic detected failure or error output for the command:
/opt/librenms/poller-wrapper.py 200
WARNING: the process took more than 5 minutes to finish, you need faster hardware or more threads
INFO: in sequential style polling the elapsed time would have been: 5710 seconds
WARNING: device 1091 is taking too long: 592 seconds
WARNING: device 710 is taking too long: 592 seconds
WARNING: device 316 is taking too long: 592 seconds
ERROR: Some devices are taking more than 300 seconds, the script cannot recommend you what to do.
I have tried changing the value between 50 and 200 but every time when running manually the poller-wrapper finishes.
We have about 2,000 devices. I look at the poller history and it shows our cisco core router and tripplites ups snmp cards takes the longest to run.
We are using a VM centos 7 20 core server, 16gb ram, and SSD drives. What would be the best solution to poller all the devices before timing out?
Heres the ./Validate
[WARN] Your install is out of date, last update: Thu, 27 Apr 2017 19:54:39 +0000
[OK] Database connection successful
[OK] Database schema correct
[FAIL] Discovery has not completed in the last 24 hours, check the cron job
[WARN] Some devices have not been polled in the last 5 minutes.
You may have performance issues. Check your poll log and see: http://docs.librenms.org/Support/Performance/
(List of devices)
and 958 more…
Have you checked the link you posted?
200 for thread count is ridiculously high, you will be doing a lot more harm than good. Turn it down to 10 to start with, go through the performance doc and see how you get on.
I have checked the link I posted.
I have tried lowering the poller-wrapper number to 10.
WARNING: the process took more than 5 minutes to finish, you need faster hardware or more threads
INFO: in sequential style polling the elapsed time would have been: 6028 seconds
WARNING: Consider setting a minimum of 23 threads. (This does not constitute professional advice!)
about 75 is the lowest that can finish under 300s.
I saw the part about RRD Caching but the SSD we are using are pretty fast. I/O doesn’t go above max.
I tired the SNMP Max Repeaters on bigger devices but doesn’t seem to help much.
Any other ideas? I did see a part about grouping devices to poll but it seems like its from different servers?
RRDCached most certainly will help.
Have you tried EVERYTHING you can in that doc, it makes recommendations over things like MySQL optimisations and other things.
Hi Thank You for your help, I have tried the MySql optimizations and RRDCacheing just now doesn’t seem to help. I have noticed under poller history that some devices are taking upwards of 200 Seconds to run. Majority run in about 40 seconds. The ones taking over 200 seconds I’ve tired the SNMP Max Repeaters on but haven’t seen an improvement. Under unpolled devices theres about 100 not pulled.
Thank You
I’d suggest you respond here listing the exact things you’ve done against each item in that document. You keep mentioning one or two things you’ve tried but the document has quite a few things.
On the devices taking 200+ seconds to finish try and disable polling interfaces that are not needed for monitoring.
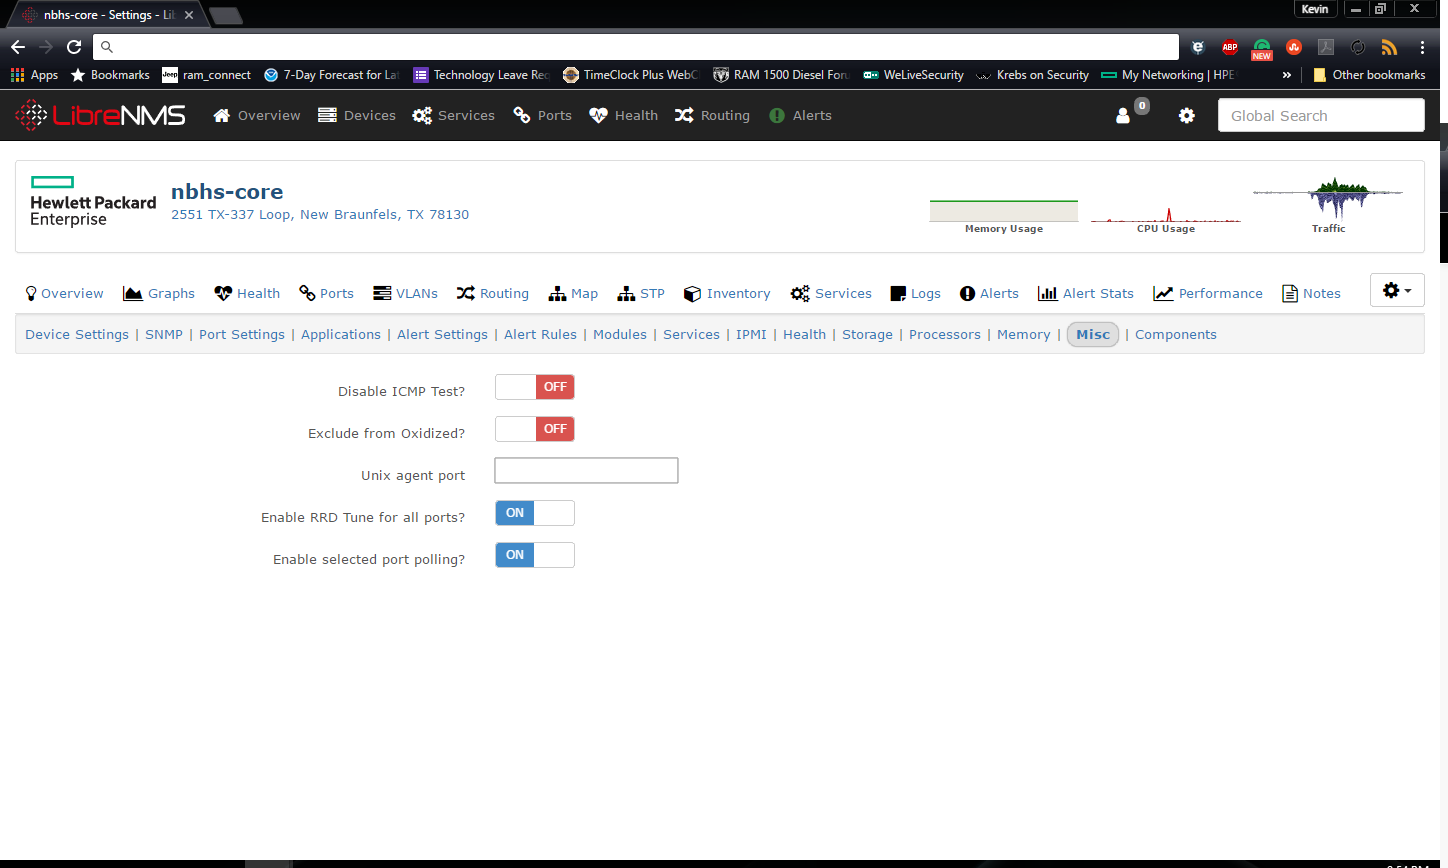
Make sure to flip the switch in “Misc” to “Enable selected port polling?”
Then go to " Port Settings" and check off the Disable and Ignore ports you don’t need.
Anyway to turn off modules for a specific group of devices like Tripplite UPS and PDUs? I only need the power information not the bandwidth port data. I saw you can exclude by OS, how can I determine what OS or is there a better way to do so?
Hi,
So far I have tried the MySQL Tunner, RRDCached, I disabled some polling modules manually, SNMP Repeaters, and Optimize Poller-Wrapper. I do want to turn off a few modules for all the Tripplite UPS and PDUs we have but can’t seem to find a way to global config for just tripplites or by group?
Thank You
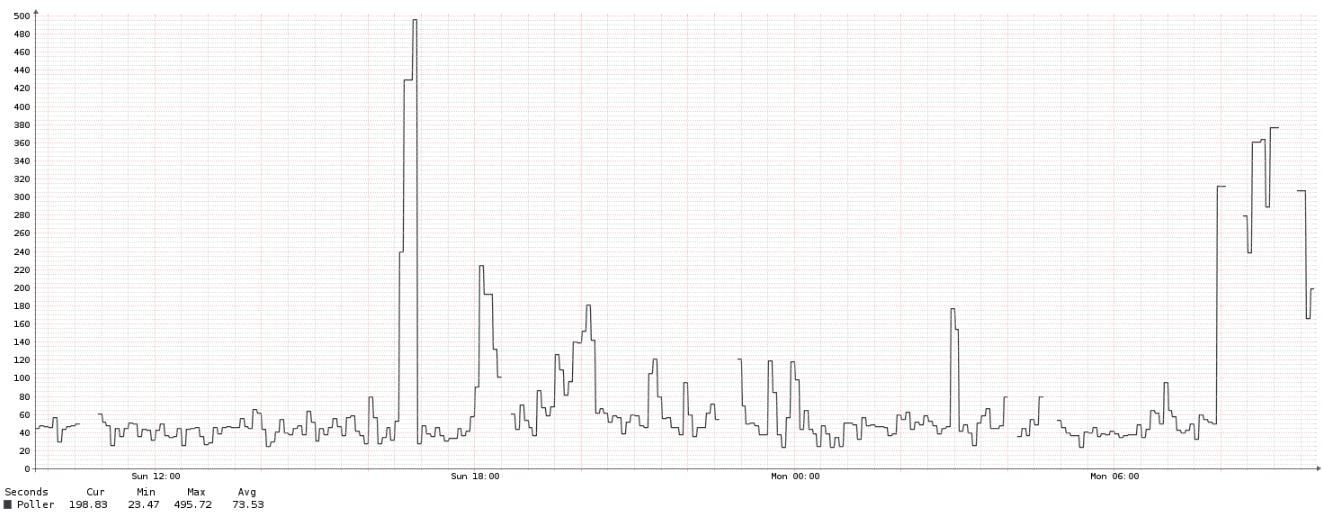
Have you checked the /Global Settings/Pollers/Poller History/ for the highest ranking “Polling Duration (Seconds)” device?
I don’t think that this is a MySQL problem.
Hi yeah I didn’t think it was a MySQL problem either or read write. I did check the poller history and it shows the longest device is 120 seconds and occasionally a list in unpolled devices. But the unpolled devices are just Cisco switches and sometimes Tripplite. The email shows device 316 is taking too long. How do I determine which is device 316? Anyway to global exclude services in spacific devices like tripplite ups?
If 316 is the device id just click on any other device and replace the id you see in the url.
To disable unused/uneeded modules you can do this in Edit device -> Modules.
@07stuntar1 I had a similar problematic one which had been a cat4503 with SUP8e.
As @laf already mentioned I have disabled all unneeded Modules and brought it down to 30 sec.
Hi @laf so I was able to narrow them down to being Tripplite devices. I guess the SNMP card on the tripplite devices are really slow. I went to Edit devices and switched off majority of the modules for one devices, seemed to help. We have over 500 tripplite devices is there a global config to exclude like wireless, vlan, sap ect… we just need to monitor up and down along with power from just tripplite devices. I saw a global command to disable modules for every devices but we want them enabled for cisco devices.
$config['poller_modules']['wireless'] = 0;
Set that in config.php for wireless, replace wireless with other module names. I’m fairly certain you can add that then enable per OS / device. Wireless (as an example) is disabled by default for all devices and enabled only for certain OS’ - Poweralert (tripplite) isn’t one of those. The poller module graph will show you which modules are currently enabled for that device.
Hi @laf Thank you for your help I think I’m beginning to narrow down and seeing less alert emails. I did see an OS based Poller config, how can I determine what OS the Tripplites are running so i can disable models by spacific os?
they are detected as ‘powerwalker’
Thank You will give it a try and post back
Hi,
So I have reduce the poller time to under 300 seconds for majority of the devices. There are still a few that I am having a hard time reducing.
1 Our main Core Router which has a lot of SNMP information on it. When walking manually it walks under 300s but occasionally it will take more then 300s. Cant figure out why.
2. One of our ESXi servers its a Cisco Systems Inc UCSC-C220-M4S. The poller times are all over for this server. From under 40s to 500s. Server is not being maxed out either.
3. Slower devices like an Axis camera. I turned off all services but port monitoring but still comes back with high poller times…