Polling just got ~300 % slower

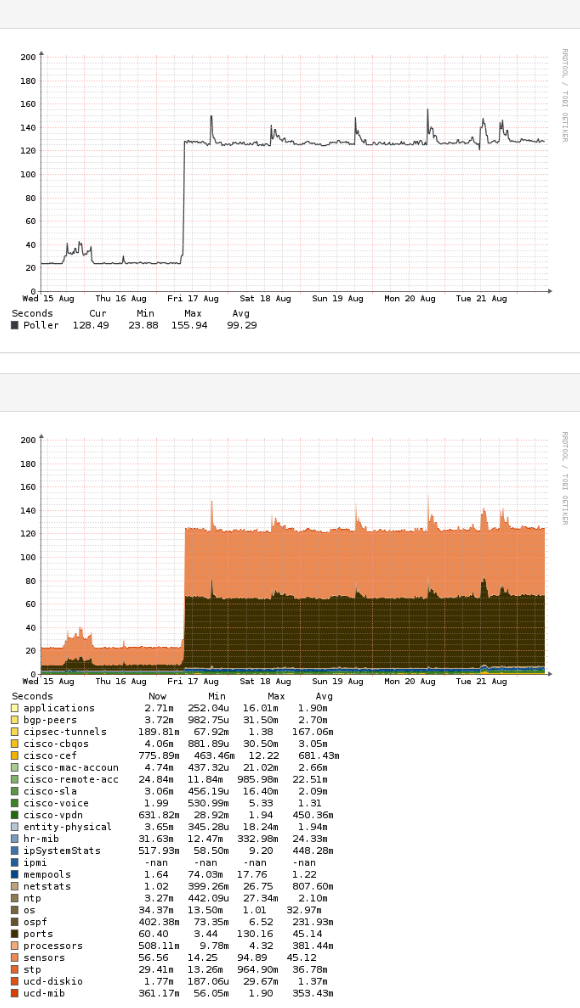
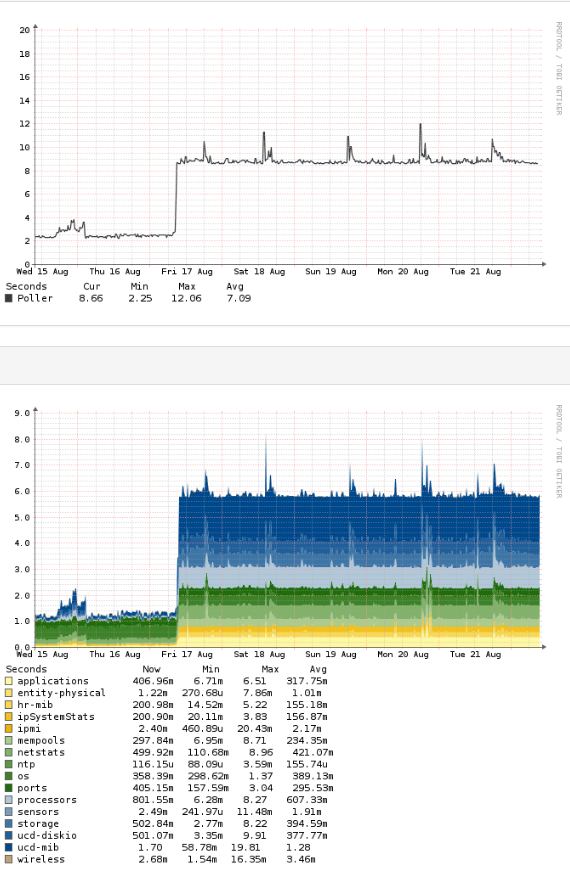
RRDcache on, local dns rekursor, pDNS etc. all was setup and I got the polling time down from 300s with defautl settings down to ~40s on one device with all devices polling less then that.

But now polling times has increased

ie:

Even localhost polling have increased.

====================================

Component Version
LibreNMS 1.42.01-63-ge448190
DB Schema 260
PHP 7.0.30-0ubuntu0.16.04.1
MySQL 10.0.34-MariaDB-0ubuntu0.16.04.1
RRDTool 1.5.5
SNMP NET-SNMP 5.7.3
====================================

[OK] Composer Version: 1.7.2
[OK] Dependencies up-to-date.
[OK] Database connection successful
[OK] Database schema correct
[FAIL] Some devices have not completed their polling run in 5 minutes, this will create gaps in data.
[FIX] Check your poll log and see: Performance - LibreNMS Docs
Devices:

[FAIL] We have found some files that are owned by a different user than librenms, this will stop you updating automatically and / or rrd files being updated causing graphs to fail.
[FIX] chown -R librenms:librenms /opt/librenms
Files:
/opt/librenms/html/plugins/Weathermap/configs/location-example.php
/opt/librenms/html/plugins/Weathermap/configs/aistest.php
/opt/librenms/html/plugins/Weathermap/configs/AIS DC.php
/opt/librenms/html/plugins/Weathermap/configs/group-example.php
/opt/librenms/html/plugins/Weathermap/configs/testmap.conf
/opt/librenms/html/plugins/Weathermap/configs/hostname-example.php
/opt/librenms/html/plugins/Weathermap/configs/home-network-example.php
weathermap has www-data as owner.

Any tips on were to start tshoot?

The max repeaters and oids are the same .

Try ./poller.php -d -h host -m ports or -m sensors, as are the ones with biggest polling times. Then you can check what is taking so much time, if SNMP, MYSQL or RRD.

I bet is a disk issue. Whats your disk I/O for librenms?

./poller.php r01 ports 2018-08-22 10:22:50 - 1 devices polled in 63.06 secs
SNMP [20/**2.67s**]: Get[3/0.05s] Getnext[0/0.00s] Walk[17/2.62s]
MySQL [1186/0.86s]: Cell[26/0.01s] Row[-26/-0.01s] Rows[18/0.04s] Column[2/0.00s] Update[1129/0.80s] Insert[37/0.02s] Delete[0/0.00s]
RRD [1138/0.23s]: Update[569/0.06s] Create [0/0.00s] Other[569/0.16s]


./poller.php ro01 sensors 2018-08-22 10:25:43 - 1 devices polled in 93.08 secs
SNMP [10/**30.53s**]: Get[10/30.53s] Getnext[0/0.00s] Walk[0/0.00s]
MySQL [94/0.09s]: Cell[25/0.01s] Row[-25/-0.01s] Rows[24/0.04s] Column[2/0.00s] Update[65/0.04s] Insert[3/0.00s] Delete[0/0.00s]
RRD [1018/0.23s]: Update[509/0.06s] Create [0/0.00s] Other[509/0.18s]

polling ports took 63s but the I cant add up to that number SNMP 2.67s , walk 2.62s are the largest parts, were are the other 50s?

polling sensors took 93.08s , we have SNMP 30.53s, get 30.53s , missing ~30s

I check with “iostat 1” and iowait never reached above 0,6%

avg-cpu:  %user   %nice %system %iowait  %steal   %idle
           1,52    0,00    1,14    0,13    0,00   97,22

Device:            tps    kB_read/s    kB_wrtn/s    kB_read    kB_wrtn
fd0               0,00         0,00         0,00          0          0
sda              54,00         0,00       796,00          0        796


dstat
    ----total-cpu-usage---- -dsk/total- -net/total- ---paging-- ---system--
    usr sys idl wai hiq siq| read  writ| recv  send|  in   out | int   csw
      8   7  85   0   0   0|  12k  632k| 210k   99k|   0     0 |2636  6748
     10   9  80   0   0   0|  20k  372k| 366k  108k|   0     0 |3366  7949
      9   6  85   0   0   0|   0   656k| 115k  421k|   0     0 |2364  5900
      5   3  92   0   0   0|4096B  552k|  77k   46k|   0     0 |1894  5036
      8   2  90   0   0   0|  32k  372k|  52k   49k|   0     0 |1593  4240
     17   4  79   0   0   0|8192B  576k| 135k 2454k|   0     0 |3135  6272
     39   6  55   0   0   0|  28k  888k|  82k  326k|   0     0 |5125    11k
      8   2  90   0   0   0|   0   736k|  32k  216k|   0     0 |1836  4359
      2   1  97   0   0   0|   0   508k|  24k   43k|   0     0 | 798  2681
      2   1  98   0   0   0|   0   384k|  21k   40k|   0     0 | 720  2598
      2   1  97   0   0   0|   0   508k|  19k   43k|   0     0 | 772  2601
      1   1  98   0   0   0|   0   836k|  19k   43k|   0     0 | 809  2589
      2   1  97   0   0   0|   0   576k|  22k   43k|   0     0 | 836  2749
      2   1  97   0   0   0|   0   452k|  25k   46k|   0     0 | 964  3016
      2   1  98   0   0   0|   0   544k|  24k   43k|   0     0 | 725  2582
      2   1  97   0   0   0|  24k  396k|  27k   48k|   0     0 | 752  2613
      1   1  98   1   0   0|  16k 2284k|  26k   46k|   0     0 |1157  2825
      2   1  98   0   0   0|  12k  524k|  26k   45k|   0     0 | 766  2758
      2   1  97   1   0   0|   0   336k|  27k   44k|   0     0 | 863  2794
      9   1  90   0   0   0|   0   556k|  34k  125k|   0     0 |1303  3657
     14   2  84   0   0   0|4096B  412k| 139k 2451k|   0     0 |2565  5689
     28   6  66   0   0   0|   0  2448k|  82k  139k|   0     0 |4982    10k
      8   2  89   1   0   0|  96k  592k|  34k  246k|   0     0 |1058  3315

When you ran the poller, did you noticed where it hangs up that time?

Running the poller there is no obvious hold up or wait times, the script is running along printing output/results continuously.

Although there’s alot of output writing to influxdb , but that has been running flawless for month.

Im gonna try and turn off influxdb and see.

Wee need influxdb tho, for our Grafana dashboards.

another observation, I have no apparent discontinuous graphs (running 1min polling) and with some polling taking 140s I should have gotten blanks in the RRD graphs.

Hello,

We are currently seeing the same issue with our LibreNMS deployment. We are seeing a notification when when logging into the portal which says: ‘It appears as though you have some devices that haven’t completed polling within the last 15 minutes, you may want to check that out :)’. Upon further investigation we have identified that 4 of our LNS routers are having issues with polling timeouts. From the poller graphs, it seems to be a timing out issue revolving around the OS/Ports. I have run snmpwalk on one of the affected devices and this is pulling data back.

Any thoughts?

Ok, polling times are down to normal values. It was the influxdb via http

This is the influx conf
#$config[‘influxdb’][‘enable’] = true;
#$config[‘influxdb’][‘transport’] = ‘http’; # Default, other options: https, udp
#$config[‘influxdb’][‘host’] = ‘thehost’;
#$config[‘influxdb’][‘port’] = ‘8086’;
#$config[‘influxdb’][‘db’] = ‘librenms’;
#$config[‘influxdb’][‘username’] = ‘theuser’;
#$config[‘influxdb’][‘password’] = ‘thepassword’;
#$config[‘influxdb’][‘timeout’] = 0; # Optional
#$config[‘influxdb’][‘verifySSL’] = false; # Optional

really odd that the http transport is the cause.
Im using ./daily script , can you somehow roll back librenms?

Try different values for max repeaters and max oids

Odd, polling is back to normal with http influx transport …

I would check LibreNMS interface utilisation and any packet loss to influxdb host etc… do you have a firewall in-front which is busy?

solved, but no, they are on the same subnet

How do you solve it?

If you have a lot of data being sent to influxdb I’d 100% switch to use udp

Thnx ill try to set that up,