I see that the page listing the devices/ports with errors show the current number of errors reported on the interface. The problem is that there is no indication if the number of errors has increased by a single error or by hundreds/thousands of errors with this display. But it appears that the error rate from the last poll is tracked by the ErrorsIn/Out_delta field.
My request is that the Delta field is displayed as the “Errors In/Out” columns. If there is a need to see the total number of errors on an interface, then those columns can be retained and re-labeled “Total Errors In/Out”.
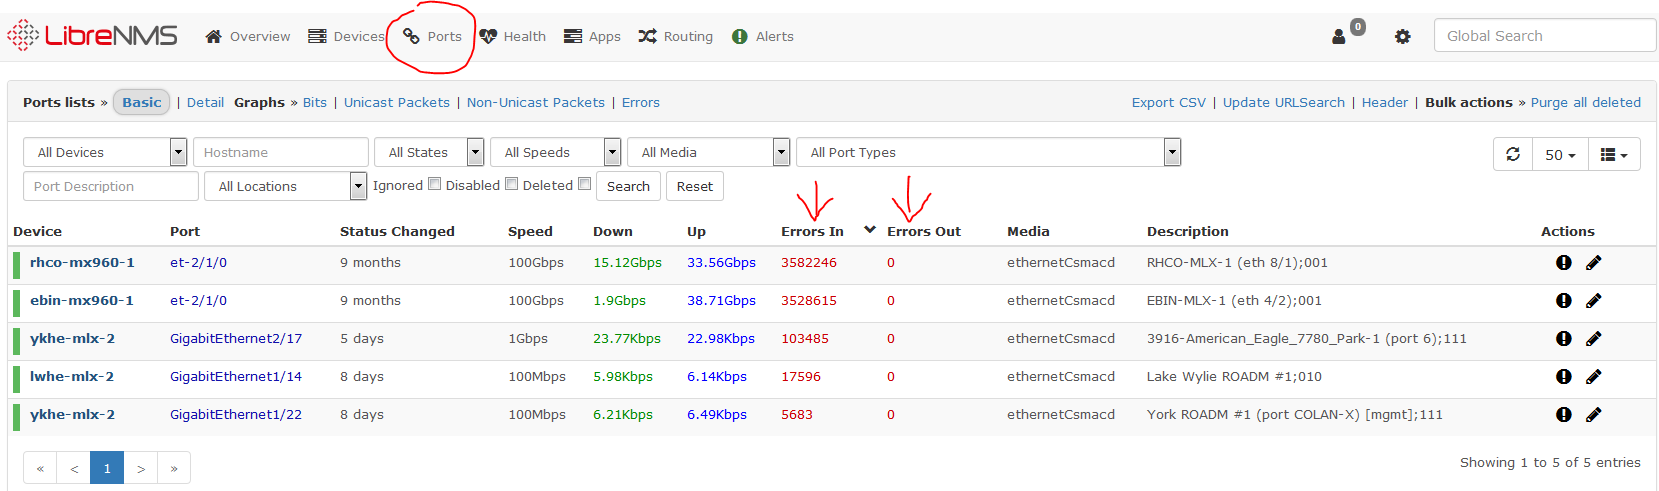
I tried opening this up as Issue 8079, but was told this was a feature request, so I am re-opening it here. I am attaching a screenshot to help clarify the request. The page itself appears under the “Ports” menu when interfaces have errors, and is what is in the screenshot. The red arrows point to the columns that I believe should report the “Delta” rather than the raw SNMP value. The issue is this page is really only showing how many errors have occured since the last time the devices were rebooted, or counters were cleared. The delta would show if it was 1 error, hundreds of errors, or thousands of errors since the last poll, which is most helpful.
4 Likes
I feel as if I have found the spot that needs to be changed, but it’s not working as I expect.
File /opt/librenms/html/pages/ports/list.inc.php on line 56 and 59 specifies the columns in question, for example:
<th data-column-id="ifInErrors" data-searchable="false" data-visible="<?php echo $errors_visible ?>"
and I think it should be:
<th data-column-id="ifInErrors_delta" data-searchable="false" data-visible="<?php echo $errors_visible ?>"
It seems an easy fix, but making this change on both the in and out errors results in nothing displayed for those columns.
Because I have an issue with this seemingly trivial error, I am reluctant to add new columns, so the last “delta” can be represented as well as “Total Errors”. I suspect that would help identify if the interface in question has a history of errors, and therefore should be monitored more closely/manually.
I have provided the screenshot @laf requested when I had this on github. I am not sure if there is any question about what I am asking, or if it’s a really low priortity?
I am wondering if @laf has been able to look at this and if there are any more questions about what I am asking?
Seems like what I am asking for is pretty simple, but as I stated originally, I can’t figure it out.
So this request’s anniversy is approaching and I thought I would try to get some input from @Kevin_Krumm since he was the one that originally said I should log this as a feature request rather than a bug.
In a nutshell, the Ports > Errors page is a list of all interfaces that have seen an error in the last poll. But rather than show the “delta” it shows the total error count. So if a device’s interface goes from 0 to 150,000 errors, it shows up as 150,000 errors. The problem is solved and no more errors appear, so it doesn’t show up on the errors page anymore. Then a year later that same interface gets 5 errors on a poll and shows up in the error list again, this time shows 150,005 errors.
I say this is a (cosmetic) bug because I don’t think it’s important to know how many errors any given interface has had over the course of weeks, months, or years. I think it’s important to note that it’s on this list because the last poll showed the errors increased by 1, 100, 1000, or ten thousand. It seems like the fix would be to simply display the error delta, either with or instead of the total error count, which seems like it should be pretty simple.
1 Like