Port Graphs - second graph on 2-week and higher graphs

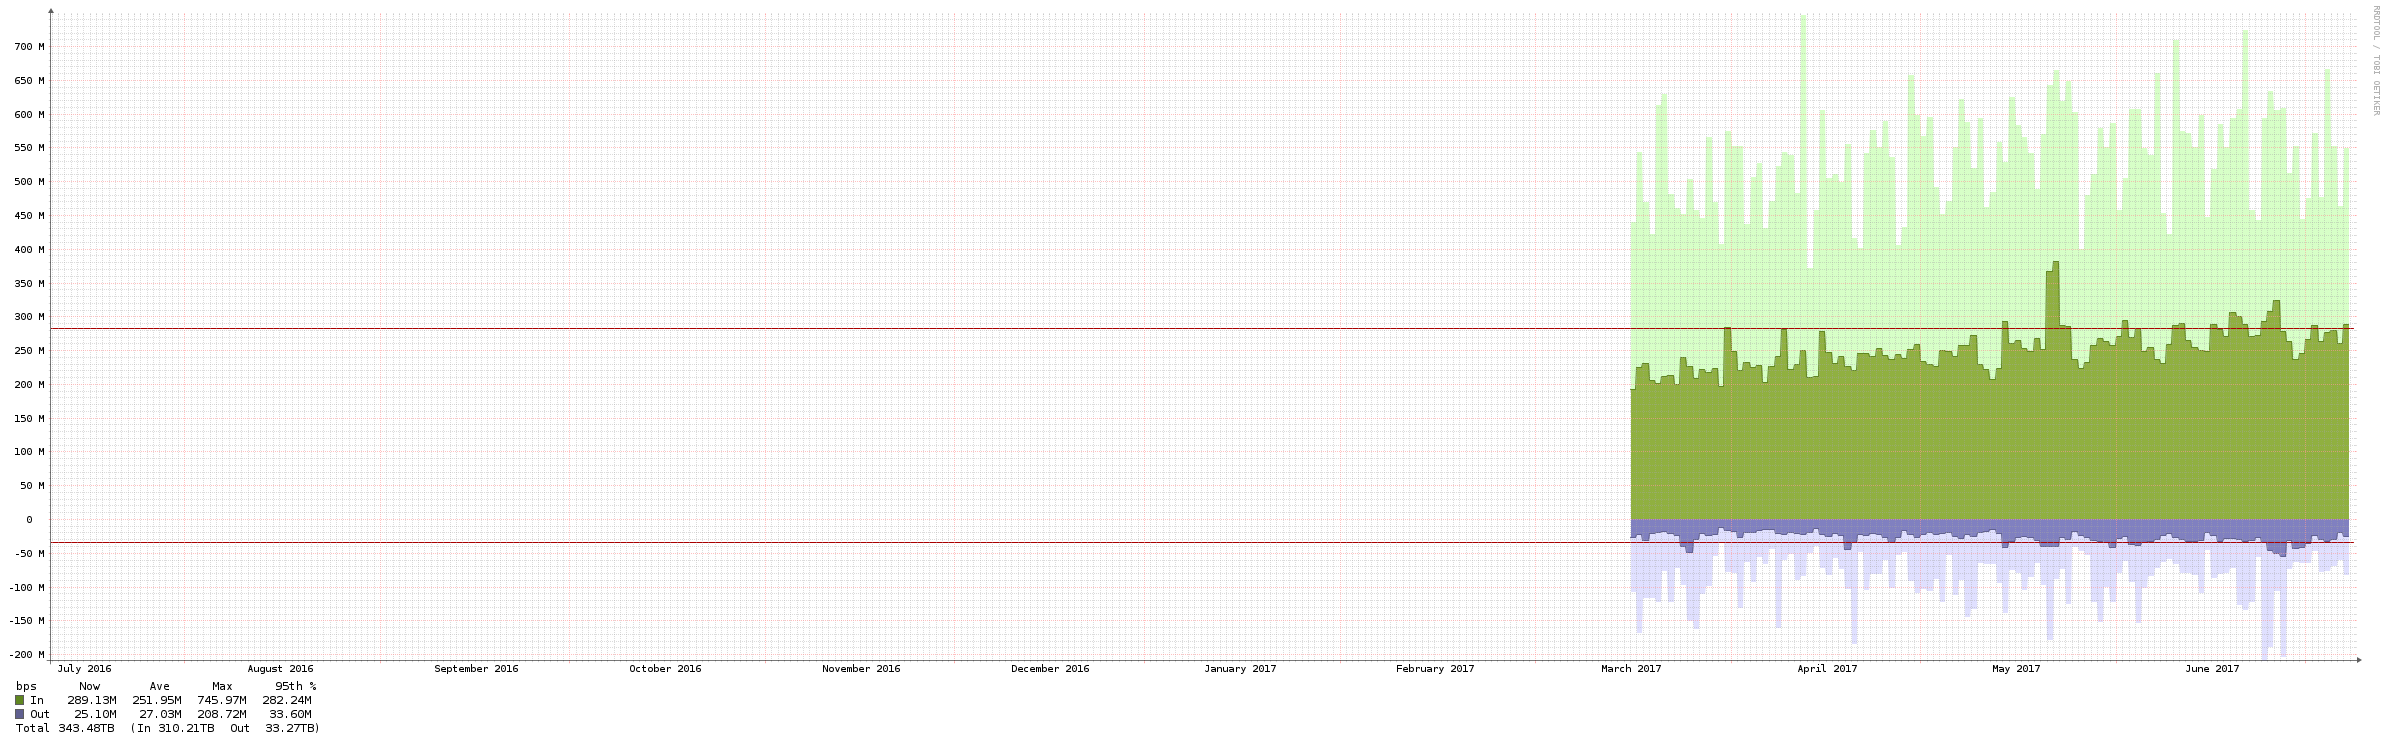
I’m creating a NOC board and I was placing a graph on the dashboard to show us overall network traffic to the internet, when I noticed that one graph in particular (the internet edge port) seems to have a second graph in the image that I’m not sure what it’s representing.

Shown below, you can see a lighter green at much higher levels behind the darker colored graph - does anyone know what this represents?

Here’s the same thing, but to a lesser extent, on the 2-week graph for the same port:

weird ghost graphs.

max values.

1 Like

If lighter shaded numbers are max values, what does the darker shaded graph represent?

Now or avg at a guess.

I would agree with average, as that would explain why it only shows up on graphs for a longer period. Would this be an RRD specific question?

I’m curious what would be the best way for a layperson to determine exactly what this is?

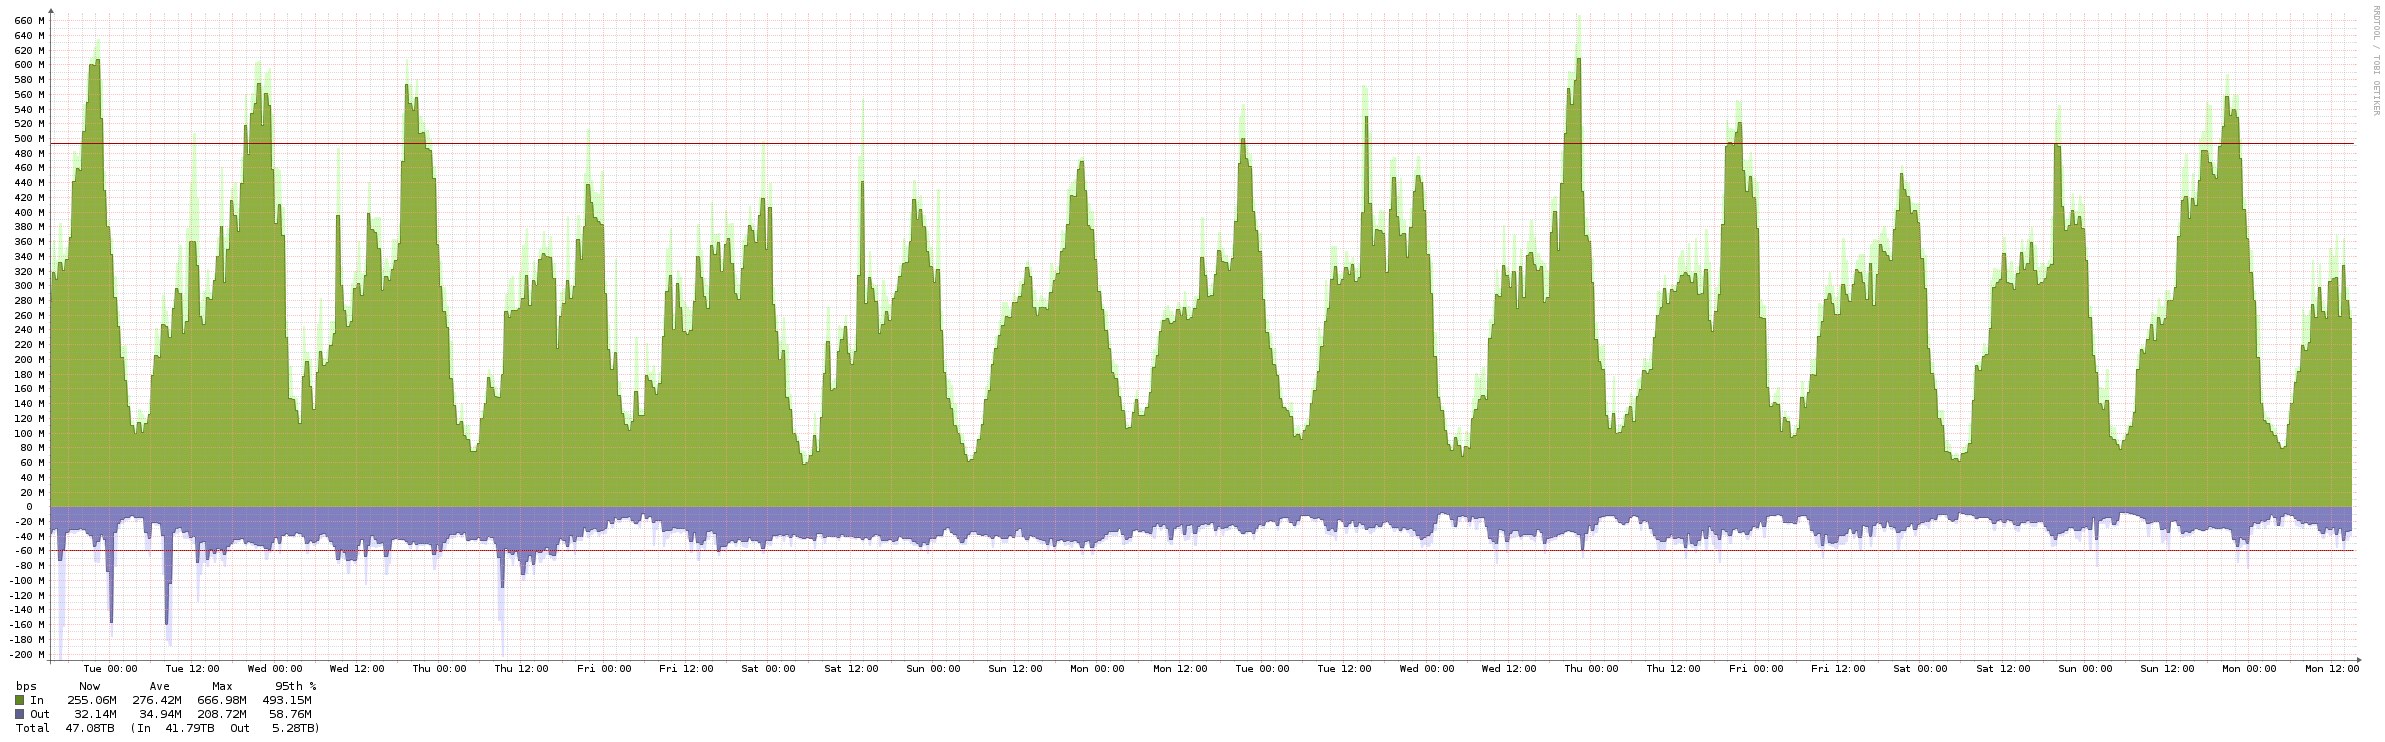
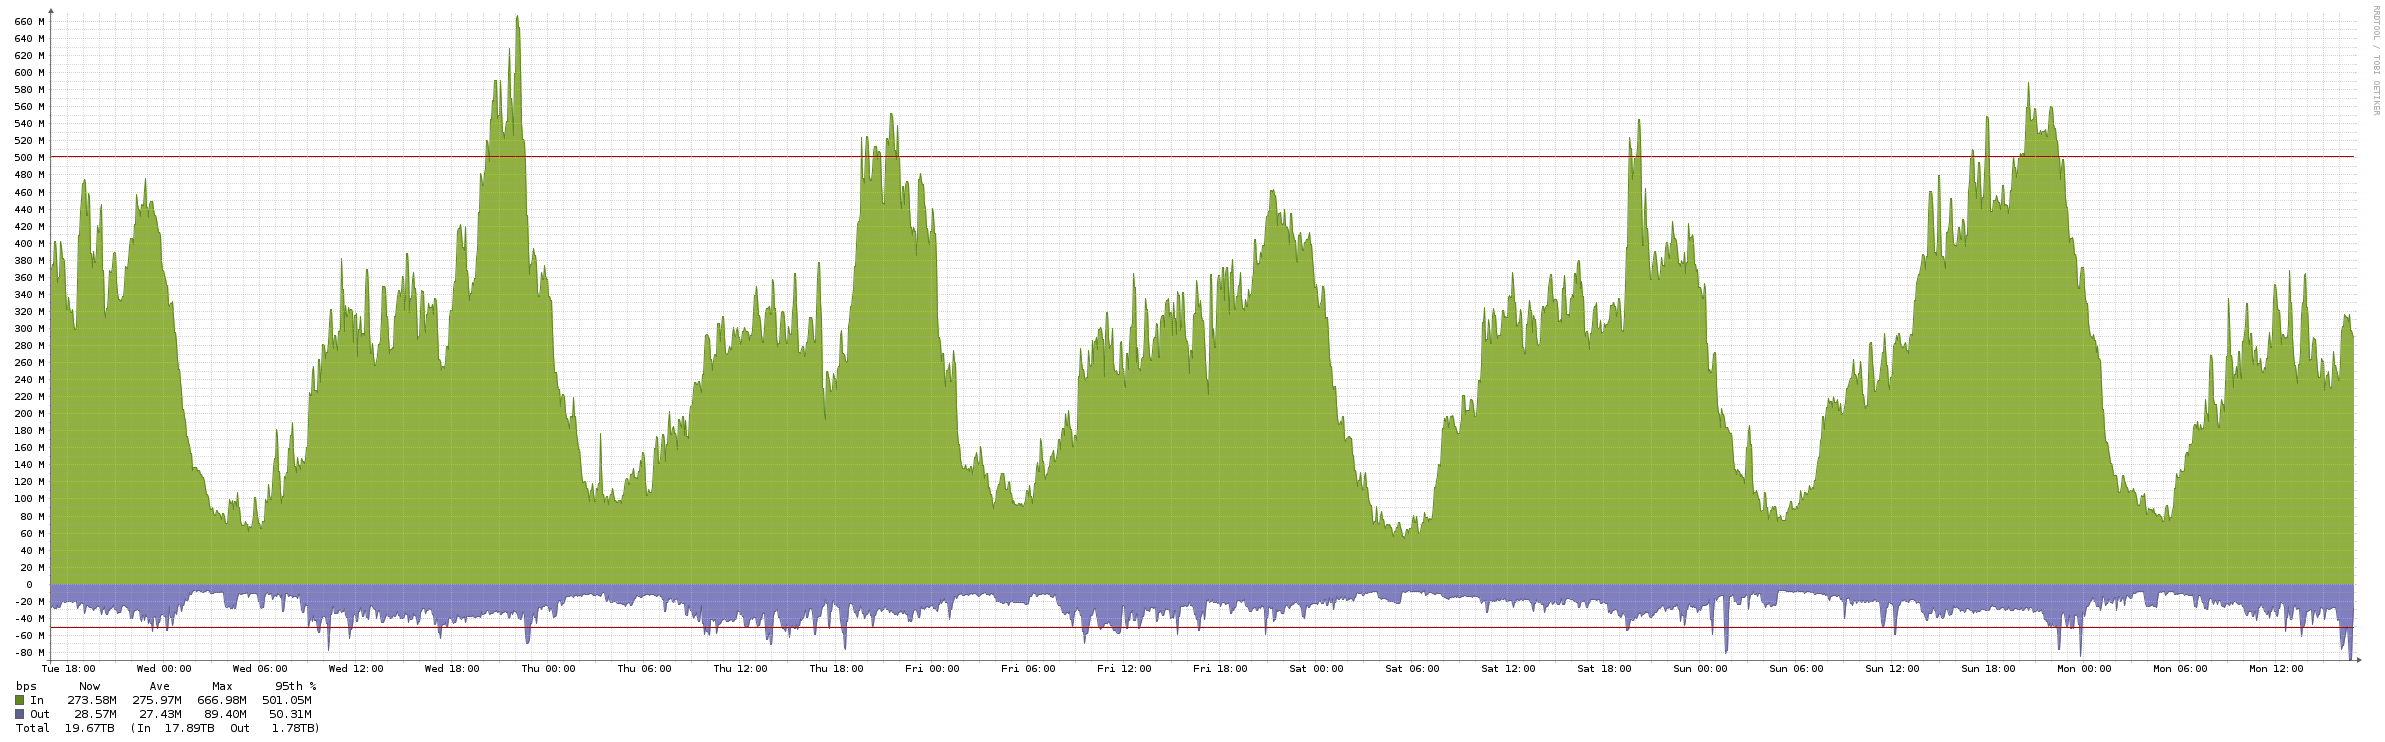
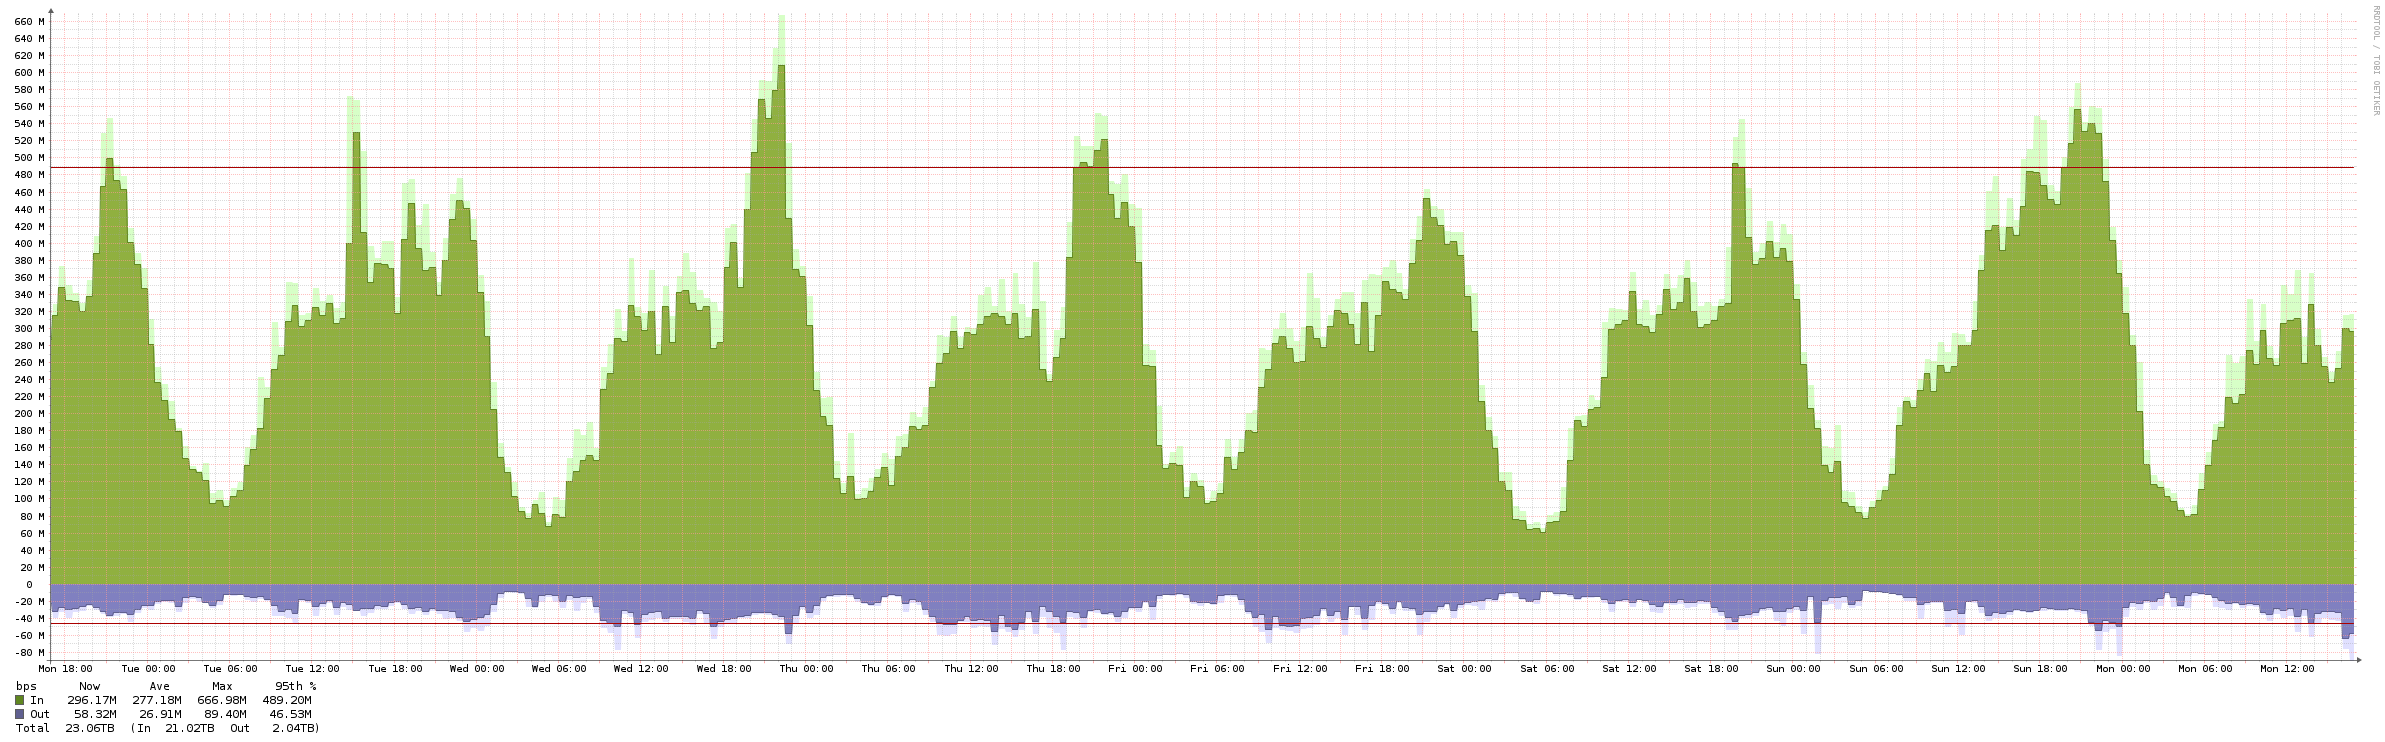
I dinked around with the graph rendering over various time periods and discovered this - it seem that when a graph has to switch to a point where there is less data resolution, or in other words when there is so much data to represent but it cannot be done in a single column of the graph.

Graph covering 1 week:

Graph covering 1 week + 1 day:

You can see how the second graph has less resolution than the first and becomes more blocky. I don’t quite understand the reasoning for showing the two, as peak rate plus 95% line is really the only data I’d be interested in seeing.

RRD by design will consolidate data over time leading to lower resolution for longer periods

Yeah, and once you go to 1 week + 1 day it’s grabbing data from the lower-resolution RRD file.

includes/default.php has

$config['rrd_rra']  = ' RRA:AVERAGE:0.5:1:2016 RRA:AVERAGE:0.5:6:1440 RRA:AVERAGE:0.5:24:1440 RRA:AVERAGE:0.5:288:1440 ';
$config['rrd_rra'] .= ' RRA:MIN:0.5:1:720 RRA:MIN:0.5:6:1440     RRA:MIN:0.5:24:775     RRA:MIN:0.5:288:797 ';
$config['rrd_rra'] .= ' RRA:MAX:0.5:1:720 RRA:MAX:0.5:6:1440     RRA:MAX:0.5:24:775     RRA:MAX:0.5:288:797 ';
$config['rrd_rra'] .= ' RRA:LAST:0.5:1:1440 ';

which if you decode (I don’t have time right now) will tell you the resolution and time coverage of each RRD.

1 Like