Hi,
I’ve some problems with reading processor usage of a particular router. I am not sure if its responding properly on SNMP requests. We have more similar routers in the field with the same setup. Network access is not the problem.
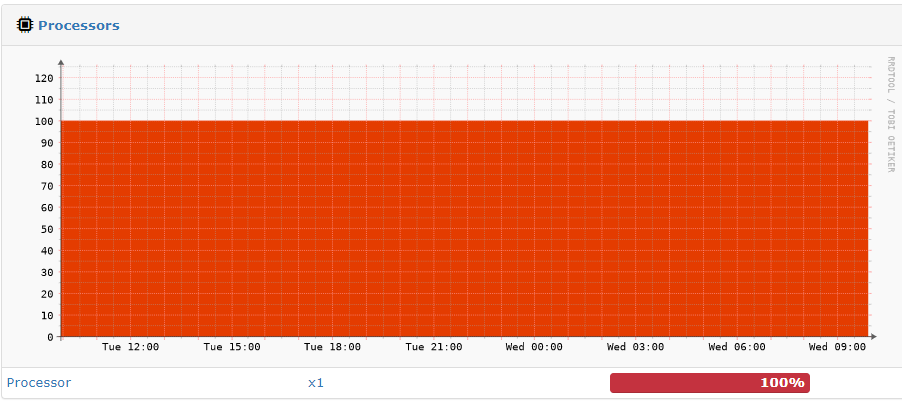
According to the LibreNMS portal the CPU of this router is always using its full potential of 100%:
But when I check the routers’ stats, it’s not even going above 50% usage. So I ran the poller command manually:
enai@tri-sdm-lib-01:/opt/librenms$ sudo ./poller.php -d -m processor -h routername SQL[SELECT* FROM devices WHERE disabled = 0 AND hostname = ‘routername’ ORDER BY device_id ASC [] 0.6ms] ./poller.php routername 2022-04-05 14:23:44 - 0 devices polled in 0.254 secs SNMP [0/0.00s]: SQL [7/0.04s]: Select[7/0.04s] RRD [0/0.00s]:
But it seems like the router can’t be polled? It’s weird because for example the traffic and temperature are shown with the correct values…