Hi,
I’ve got some devices polled by LibreNMS, and all are looking fine inside of LibreNMS.
I’ve also got Prometheus Pushgateway configured.
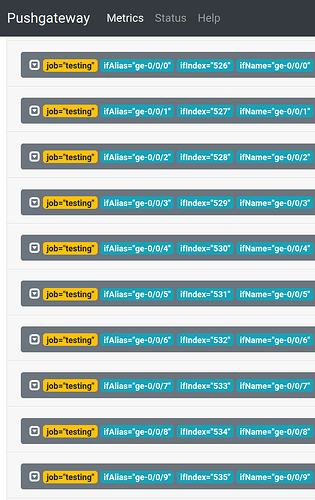
Unfortunately, if seems that metrics from all interfaces that include forward slashes (e.g. “ge-0/0/0” from a Juniper device) are not appearing in Prometheus.
I’m not going to pretend I fully understand the problem, but it seems to be because LibreNMS is sending un-escaped parameters to Pushgateway.
Here’s an example log that from LibreNMS, trying to push this to Pushgateway:
[2020-05-13 01:10:50] production.ERROR: Prometheus Exception: Client error: `POST http://prometheus:9091/metrics/job/librenms/instance/juniperhost1/measurement/ports/ifName/ge-0/0/0/ifAlias/ge-0/0/0/ifIndex/533` resulted in a `400 Bad Request` response:
improper label name "0"
There is a relevant pull request (https://github.com/prometheus/pushgateway/pull/268) and documentation (https://github.com/prometheus/pushgateway#url) from the Pushgateway repository which explains how to resolve this, by using base64 encoding.
The URL needs to be changed to the following
http://prometheus:9091/metrics/job/librenms/instance/test/measurement/ports/ifName@base64/Z2UtMC8wLzA=/ifAlias@base64/Z2UtMC8wLzA=/ifIndex/533
Which successfully adds the metric to Pushgateway.
I’m not familiar with how the LibreNMS repo works. Is this something that I should raise an issue for?
