QSFP dBm readings - Incorrect Metrics

According to docs, dBM class should show dBm measurement which makes sense. This works as expected for standard SFPs, however, it seems to have mixed results for QSFPs.

Steps to reproduce an issue:

To reproduce, navigate to Device > Health > dBm, and find a QSFP port.

For some QFSP lanes, Y axis gets a metric of ‘m’ represented in 3 digit numbers for both RX and TX, and other lanes get ‘m’ metric for either RX or TX, and integer metric for other.

The output of `./validate.php:

====================================
Component | Version
--------- | -------
LibreNMS  | 21.3.0-20-g7dbb2e42b
DB Schema | 2021_03_26_014054_change_cache_to_mediumtext (202)
PHP       | 7.4.3
Python    | 3.8.5
MySQL     | 10.3.25-MariaDB-0ubuntu0.20.04.1
RRDTool   | 1.7.2
SNMP      | NET-SNMP 5.8
====================================

[OK]    Composer Version: 2.0.11
[OK]    Dependencies up-to-date.
[OK]    Database connection successful
[OK]    Database schema correct

Browsers tried:

  • Firefox 86.0.1 (64-bit)
  • Chrome 89.0.4389.90 (Official Build) (64-bit)

Example 1:

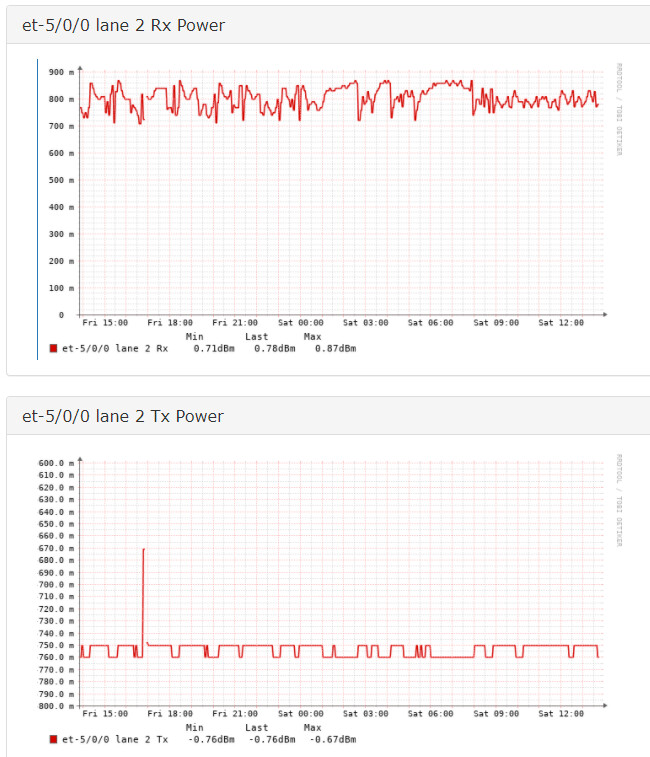
  • On the device, TX is -0.76 dBm, and RX is 0.79 dBm.
  • In LibreNMS, Y axis for TX shows 760.0 m, and RX shows 790 m.

Output from the device:

  Lane 2
    Laser bias current                        :  5.978 mA
    Laser output power                        :  0.839 mW / -0.76 dBm
    Laser receiver power                      :  1.200 mW / 0.79 dBm
    Laser bias current high alarm             :  Off
    Laser bias current low alarm              :  Off
    Laser bias current high warning           :  Off
    Laser bias current low warning            :  Off
    Laser receiver power high alarm           :  Off
    Laser receiver power low alarm            :  Off
    Laser receiver power high warning         :  Off
    Laser receiver power low warning          :  Off
    Tx loss of signal functionality alarm     :  Off
    Rx loss of signal alarm                   :  Off

Example 2:

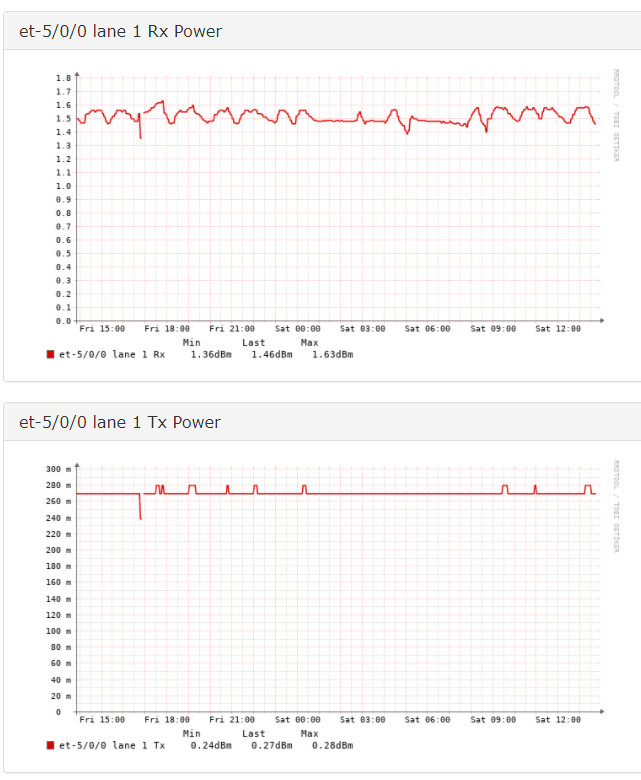
  • On the device, TX is 0.27 dBm, and RX is 1.58 dBm.
  • In LibreNMS, Y axis for TX shows 270 m, and RX shows 1.58 as expected.

Output from the device:

  Lane 1
    Laser bias current                        :  6.184 mA
    Laser output power                        :  1.065 mW / 0.27 dBm
    Laser receiver power                      :  1.438 mW / 1.58 dBm
    Laser bias current high alarm             :  Off
    Laser bias current low alarm              :  Off
    Laser bias current high warning           :  Off
    Laser bias current low warning            :  Off
    Laser receiver power high alarm           :  Off
    Laser receiver power low alarm            :  Off
    Laser receiver power high warning         :  Off
    Laser receiver power low warning          :  Off
    Tx loss of signal functionality alarm     :  Off
    Rx loss of signal alarm                   :  Off
    Tx laser disabled alarm                   :  Off

How can I resolve this issue? Is this a bug?

Hi @jakub
m stands for 10^-3 . So 790mdBm is 0.79dBm. I don’t see anything wrong here. Could you explain ?

Hi @PipoCanaja

Thanks for getting back to me.

I find the graphs confusing to read because like shown in example 1, you need to work out what 760.0m means (on the device, it is -0.76). The figure doesn’t have a minus sign in front of it, also I don’t get why some values end with .0, and some not.

In example 2, clearly, the RX graph has put a correct value on the Y-axis of what it actually is on the device - it starts at 0.0, increments by 0.1, and shows 1.5 because the reading is 1.5.

In my view, something is wrong here because every graph is displayed differently and that is confusing.

edit: essentially, what I’m saying is that the retrived values are correct, but the y-axis dispalys weird behaviour of different metrics for different graphs.

Agreed, the sign is not displayed on the Y axis which is false and annoying. On the other end, the fact that we display the value in SI units is normal and should not be changed. Will try to see if I can reproduce this in my env and fix it.

Thanks, I’m happy to work with you on this if you need any outputs from my env etc. Just let me know.

Regarding SI units, why do some graphs show the exact value from the device like 1.5 (example 2, Rx Power), and some show value like 270 m instead of 0.27 (example 2, Tx Power)? I don’t understand why that is.

@jakub
Both values are exact, mathematically speaking, cause they are perfectly equal. This is the way it must be displayed. 3 significant digits, and value between 1 and 999. So 1.27 is correct and 370m is correct. 0.37 is not.

I think the issue here might be that we removed the individual poller file in favour of using a user_func in discovery.

This means that the mW to dBm conversion takes place after the rounding whereas it used to take place before.

i.e

PREV: 0.79
NOW: 0.794374832

we should be able to reinstate this by re-adding a poller file that rounds the end value, without the need for the other conversion logic that was previously used.

Edit: Nope, tested this and it didn’t work, ignore me :frowning:

This topic was automatically closed 91 days after the last reply. New replies are no longer allowed.