Random(?) SNMP failures

Hello,

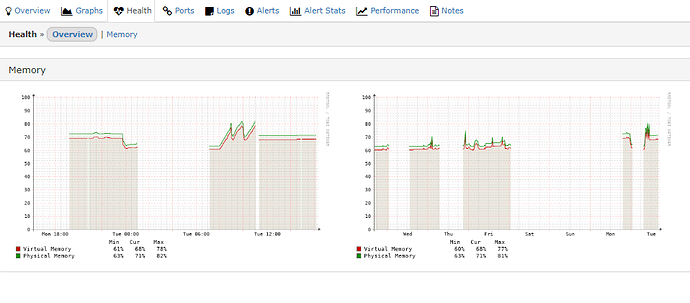
I’m running into a strange issue I’ve never seen before. There are gaps in the graphs, but the gabs in one graph (CPUs for instance) are not lining up with the gabs in other graphs (RAM, for instance), and I’m not seeing any significant spikes in activity from remaining graphs when one disappears.

Here is the graphs from Procs, RAM, and Disk usage for the last week:

I’m using SNMP v2c and the remote system is running Windows Server 2016.

  • Steps to reproduce an issue.
    Set up this server to monitor SNMP.
    Watch graphs

  • The output of ./validate.php

    $ /opt/librenms/validate.php

    Component Version
    LibreNMS 1.50-54-gea8f0de
    DB Schema 2019_02_10_220000_add_dates_to_fdb (132)
    PHP 7.2.14
    MySQL 5.5.60-MariaDB
    RRDTool 1.4.8
    SNMP NET-SNMP 5.7.2
    ====================================

    [OK] Composer Version: 1.8.5
    [OK] Dependencies up-to-date.
    [OK] Database connection successful
    [FAIL] Time between this server and the mysql database is off
    Mysql time 2019-04-26 17:04:33
    PHP time 2019-04-26 13:04:33

    [OK] Database schema correct
    [FAIL] You have a different system timezone (UTC) than the php configured timezone (EDT)
    [FIX]:
    Please correct either your system timezone or your timezone set in php.ini.
    [WARN] Your install is over 24 hours out of date, last update: Wed, 24 Apr 2019 08:09:48 +0000
    [FIX]:
    Make sure your daily.sh cron is running and run ./daily.sh by hand to see if there are any errors.
    [FAIL] Some folders have incorrect file permissions, this may cause issues.
    [FIX]:
    sudo chown -R librenms:librenms /opt/librenms
    sudo setfacl -d -m g::rwx /opt/librenms/rrd /opt/librenms/logs /opt/librenms/bootstrap/cache/ /opt/librenms/storage/
    sudo chmod -R ug=rwX /opt/librenms/rrd /opt/librenms/logs /opt/librenms/bootstrap/cache/ /opt/librenms/storage/
    Files:
    /opt/librenms/bootstrap/cache/packages.php
    $
Hi,

Could you fix those issues reported by validate.php before moving forward. Set the same timezone everywhere, update LibreNMS to the latest version and fix the incorrect file permissions by running the commands provided in the output of validate.php.

[root@librenms ~]# /opt/librenms/validate.php

Component Version
LibreNMS 1.50-72-g9cfa2aa
DB Schema 2019_02_10_220000_add_dates_to_fdb (132)
PHP 7.2.16
MySQL 5.5.60-MariaDB
RRDTool 1.4.8
SNMP NET-SNMP 5.7.2

====================================

[OK] Composer Version: 1.8.5
[OK] Dependencies up-to-date.
[OK] Database connection successful
[OK] Database schema correct
[root@librenms ~]#

With the updates the same issues are recurring.

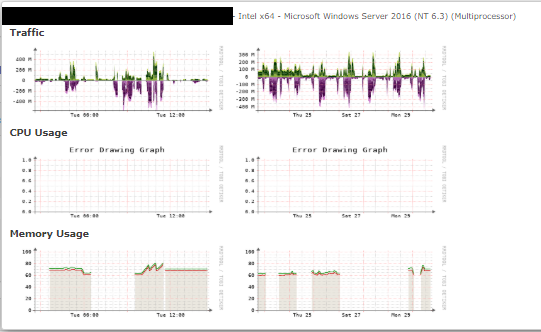
The logs say all CPUs are removed for a time then the logs say they are added in. While “removed” the CPU graphs are showing red on the summary page and on the CPUs page, “Error Drawing Graph” with no historical information. The historical info re-appears when the CPU info is reporting again.

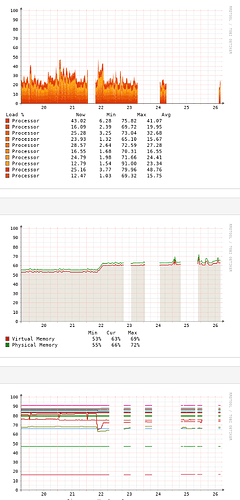
Other charts are showing random missing data, but the time framed show no correlation. They seem very random. Local PerfMon graphs show no unusual not spikey activity for the missing data time periods.

Any ideas here? I’m at a complete loss.

Did you check if your local timezome (timedatectl status), matches the timezone set in php.ini ?

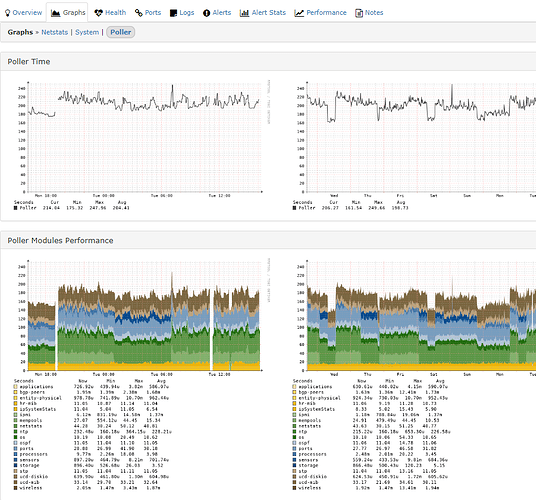
What does your Poller Modules Performance graph look like for this device? (Device -> Graph-> Poller)

I have all time zones (My, PHP, System) all set to UTC.

RAM over the same time:

I can’t show CPU because it is currently still missing. All graphs are blank.

I realized a good illustration is the tooltip for the host:
image

You can enable logging to see if it gives you more info. Set -d on the wrapper and it will create a ton of logs in the log directory (don’t leave it enabled).

I suspect the issue here is that Windows snmp service sucks :frowning:

Great… where do I find the command line for that wrapper?

bump

Where would I edit that commandline?

Its here https://docs.librenms.org/Support/Poller%20Support/

Nothing useful in the debug logs… but it suddenly cleared up. I guess I’ll wait to see if it gets wonky again and check again then.

Likely the device not responding to snmp sporadically.