Hello,
I apologize if my question sounds naive since I recently migrated to LibreNMS.
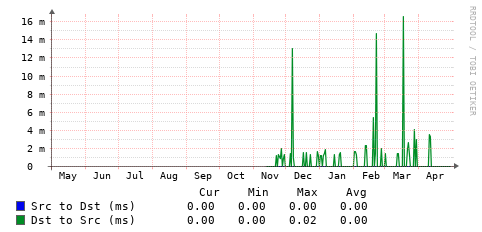
I am having a hard time to understand how SLA packet loss is calculated and why is it shown in ‘ms’ instead of ‘%’. An instance of the graph in question is shown below:

I appreciate any help.
Hello!
Not entirely sure why it says “ms” but i assume it’s measured in milli since thats on the y axis. For that I made a short explanation about this here,
Interface Error Graph Explaination
A different graph but you can use the same calculation 