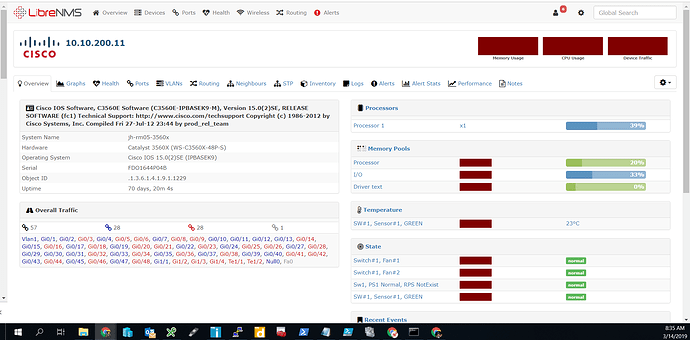
So yesterday i managed to fumble through updating my PHP version. Initially i just installed the new PHP version but that ended up giving me a bad gateway error. After spending too much time editing the www.conf and librenms.conf files i decided to just uninstall everything php related and reinstall 7.2. This seemed to work for the most part. i was able to get back to the application so i proceeded to update using daily.sh and i also proceeded to update the DB schema as well. once i got the validate.php all green i hopped in to the application to take a look and that’s when i noticed all my graphs were broken. also, i’m not able to see any of my alerts. although i still get alert emails, they don’t make any sense (ex: "Rule: {if %name}%name{else}%rule{/if} ").
Here is the output of validate.php:
====================================
| Component | Version |
|---|---|
| LibreNMS | 1.49-54-g3905423 |
| DB Schema | 2019_02_10_220000_add_dates_to_fdb (132) |
| PHP | 7.2.16 |
| MySQL | 5.5.60-MariaDB |
| RRDTool | 1.4.8 |
| SNMP | NET-SNMP 5.7.2 |
| ==================================== |
[OK] Composer Version: 1.8.4
[OK] Dependencies up-to-date.
[OK] Database connection successful
[OK] Database schema correct
