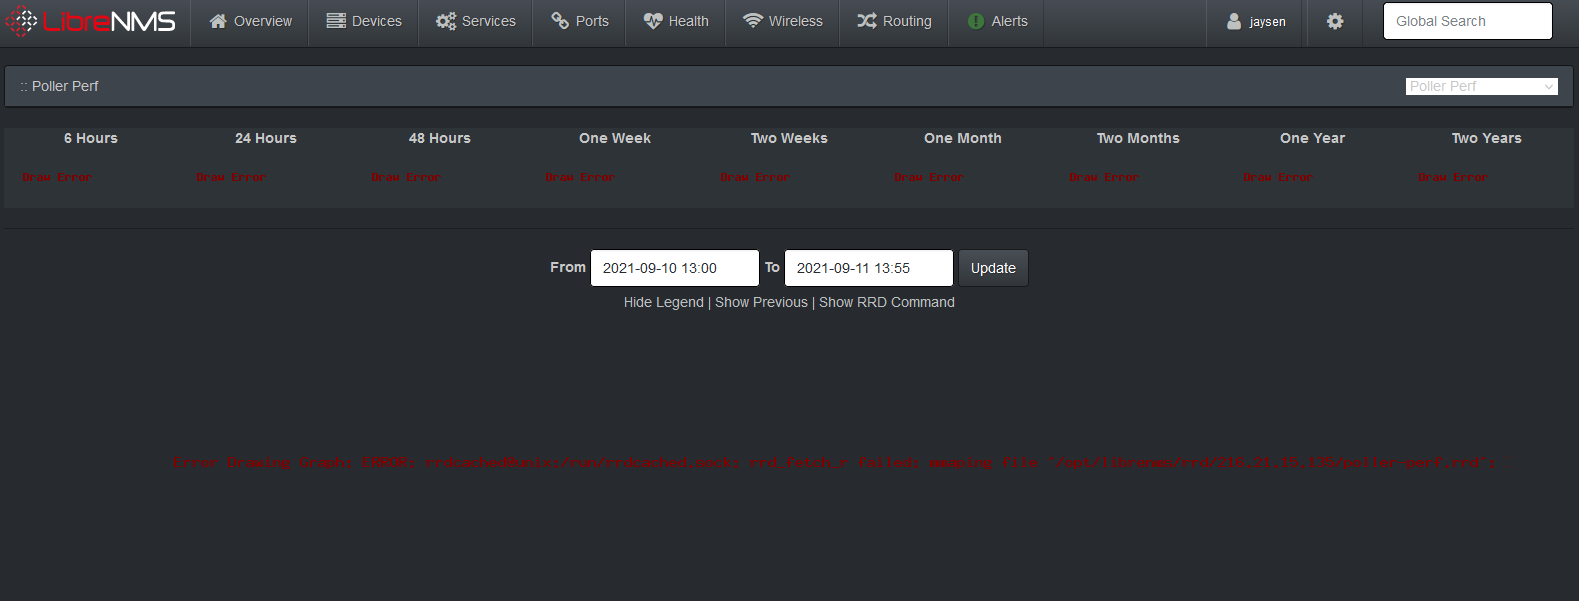
I am having an issue with some of my graphs being created and was hoping to get some insight as to what might be going on here. I am running LibreNMS on an Ubuntu 20.04 LTS server with rrdcache. I’ve followed all of the documentation to set it up and for the most part it all seems to be working well with the exception of the following errors that I’m seeing under Poller > Performance. See Attached Screenshots
I’ve run the ./daily.sh and the ./validate.php scripts and receive no errors. The poller-perf.rrd file does exist and permissions seem to be correct but it appears no data is bring written. Could someone help me figure out what might be going on and point me in the right direction as to where to start looking? I’ve spent a few days trying to figure this out and I’m not having much success.
Thanks for your response. Disk space doesn’t appear to be an issue. I’m not seeing any errors indicating that I am out of space. I’m curious what the invalid argument error at the end of the rrd command is all about.
I went ahead and removed all the 0 sized files per your suggestion. Watching to see if they are recreated.
After deleting the 0 sized files. LibreNMS did recreate them and it is now writing to them. However I still have the same error on now another device. I suspect I have 0 sized files on all of my devices that once removed and recreated it will resolve the problem. It’s looking like I have some work to do to clear them out. I have over 1000 devices. This is going to be fun.
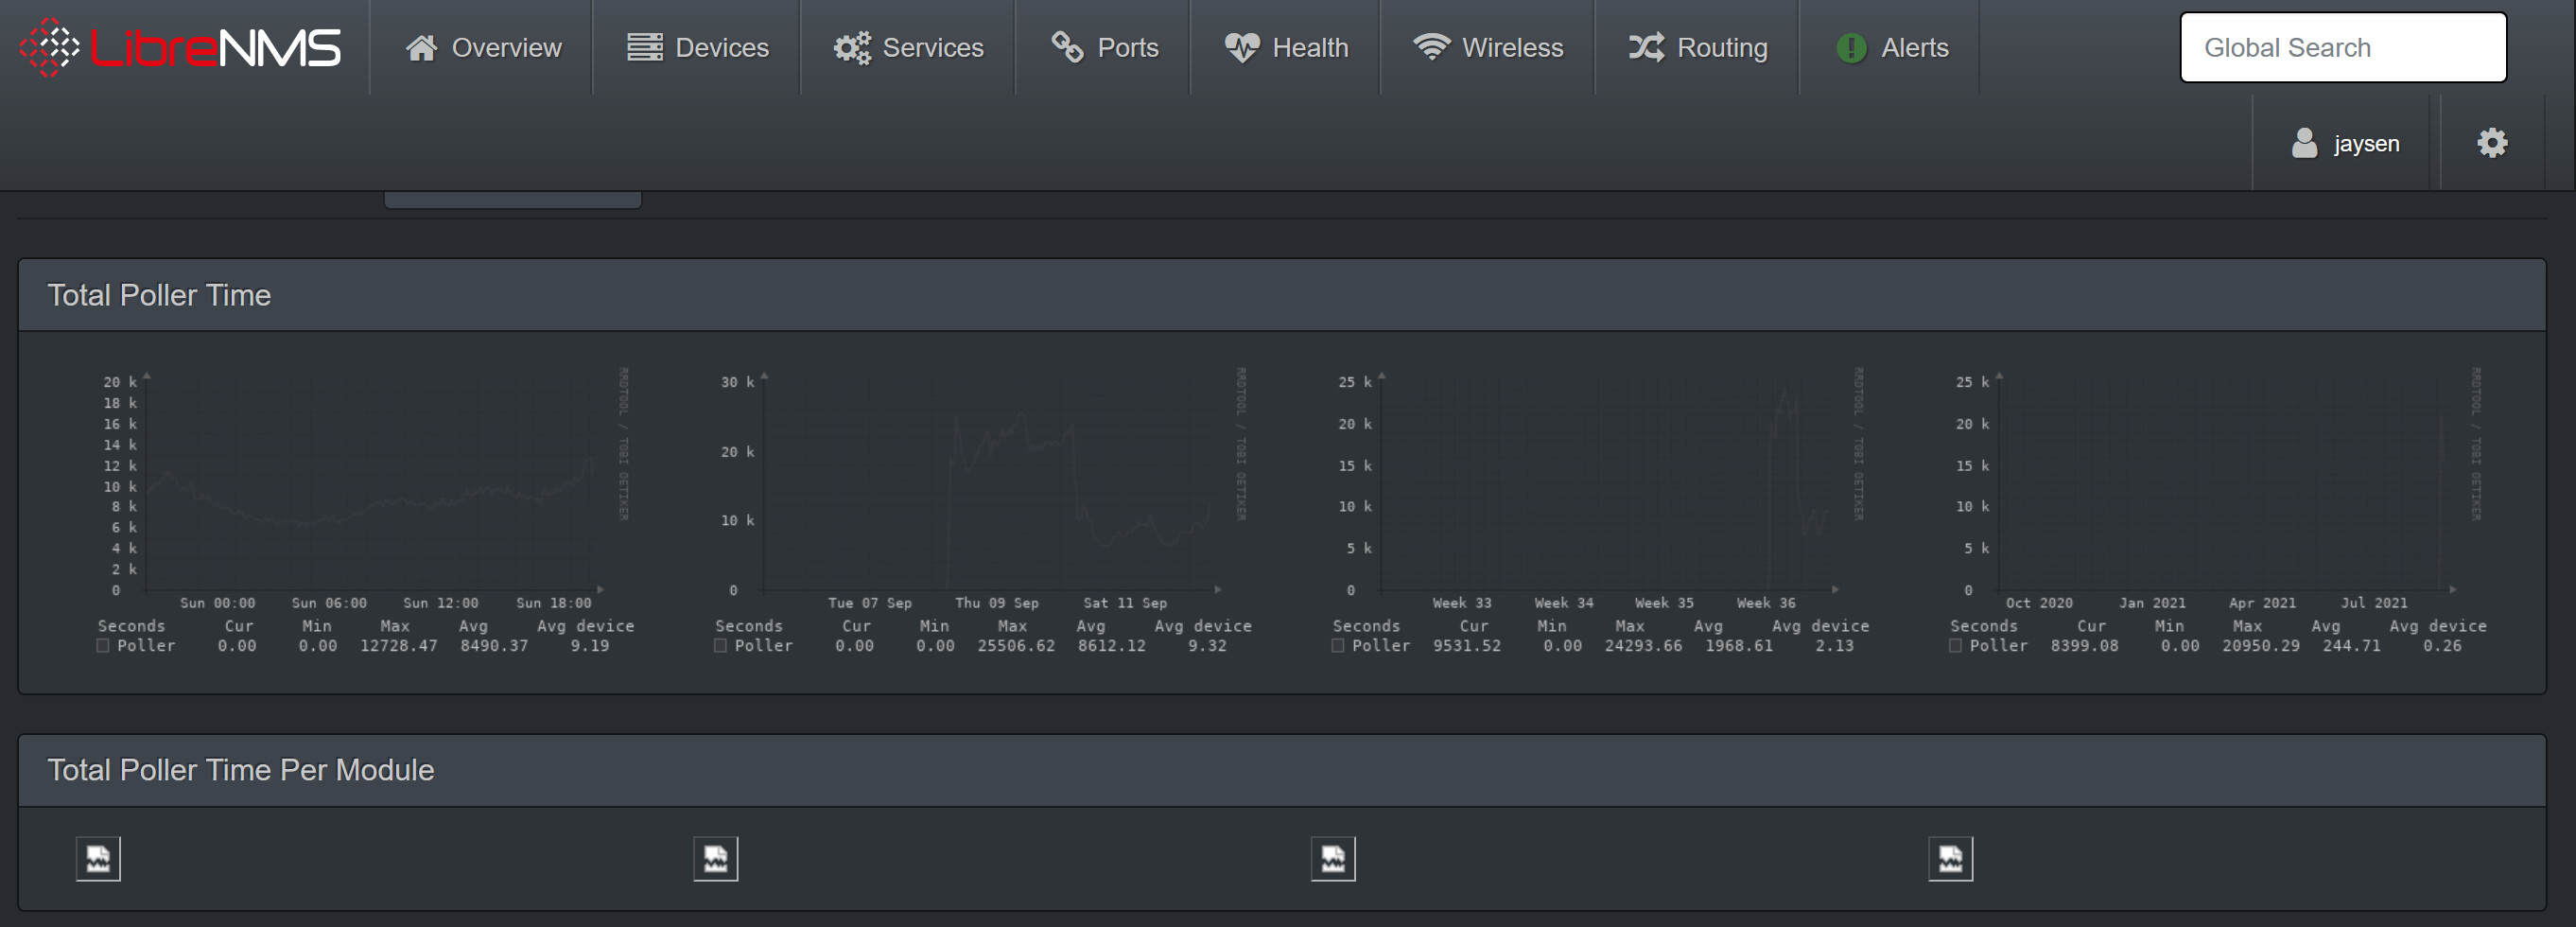
I was able to use a find command to search for all the 0 sized files in my rrd directly and remove them quickly. The graphs are now showing under Total Poller Time but now I get broken images under Total Poller Time Per Module.
If I click on one of the broken images to see if it gives me an error or a clue as to what’s going on. It will spin it’s wheels for about a minute and then I get a gateway timeout error. I’m not sure what is causing the gateway timeout now. It wasn’t doing that before I deleted the 0 sized files.
I am running rrdcached and when I do a systemctl status on it. It did initially give me an error about it not being able to read an RRD file. I restarted rrdcached and that error is now gone and it seems to restart normally. I also restarted nginx and php7.4-fpm services and they restart normally with no errors.
I ran ./daily.sh and ./validate.sh and get no errors.
Could there be something in my cache that is causing it to hang up and give me gateway timeouts? Any thoughts?
The total poller time graphs are showing up. It’s the Total Poller Time Per Module graphs below those graphs that are broken as shown in my screenshot. The other day I tweaked some php-fpm settings to increase the number of servers and I did get one of those graphs to show up but now it’s back to the broken images again. It’s been days and still nothing appears. I’m not sure how much time needs to pass before they will show up but it doesn’t seem normal to have broken images.
This tells me there is something going on with php-fpm. I’ve tried over the last week various performance tweaks including increasing the max children and max servers. I’ve thrown more CPU and RAM at it. I’ve even tried switching to static mode and increasing the max children and max requests to an insanely high number. It’ll work temporarily but then back to timing out again. I’ve even tried changing my nginx worker processes to match the number of CPU cores and also increased the number of worker connections. I turned multi accept on. I tried disabling access logging to free up disk i/o and memory. Nothing seems to fix this. I’m at a loss.
Each php process that spawns takes up around 52MB of memory.
I am running this on a proxmox host and my VM setup is follows:
Ubuntu 20.04 LTS
php7.4/php7.4-fpm with opcache enabled
rrdcache is also enabled
CPU: 16 total cores split between 2 sockets
32GB RAM
100GB disk space
I’m polling maybe around 1000 or so devices, mostly ubiquiti, mimosa, and cambium devices.
Every other librenms page seems to load very quickly. It’s just the poller performance pages that are an issue.
Any more ideas or things to try would be very helpful.
Thank You! I increased the timeouts to 300s and that did get the graphs to load and resolve the timeout issue. However it still takes an incredibly long time to load them. Seems like it takes between 2-4 minutes or more to load. This is only in the poller performance page. The rest of librenms seems to load fairly quickly. Do you have any further suggestions on how to speed that up? With 16 cores and 32GB of RAM I would think performance would be better. Proxmox shows it’s only using around 23% - 26% of RAM and 22% - 32% of CPU. Not sure why this is so slow.