Have an odd issue that just started occurring after upgrading servers from Debian to Ubuntu along with PHP to 8.3.
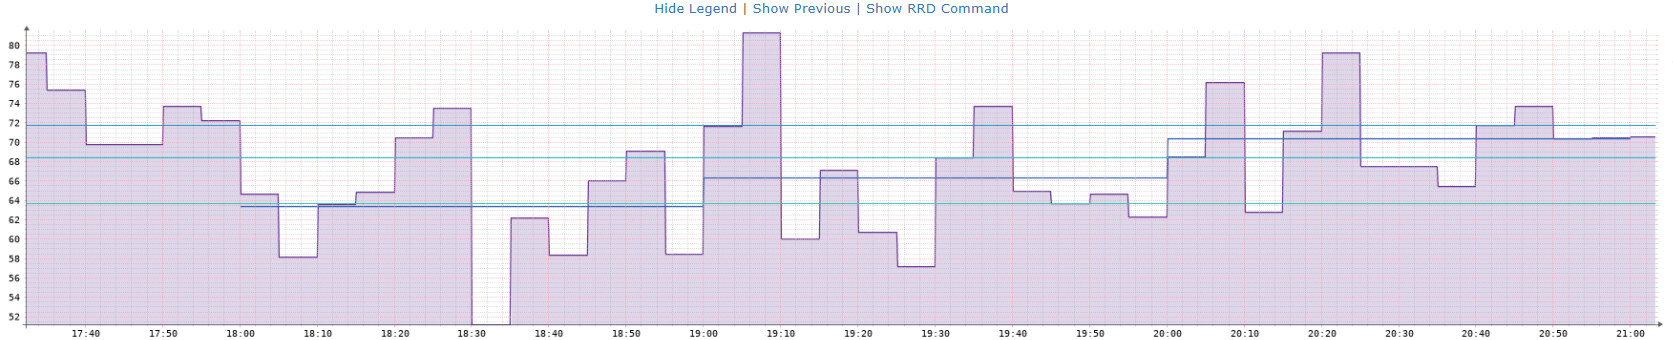
During peak usage the RRD graph do not fill out for a particular interface. All other interfaces are fine. But this is also the highest utilized port being monitored.
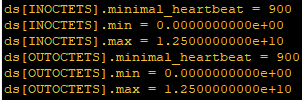
In the past the interface was set to a bandwidth 40Gbps but was adjusted to the physical interface 100Gbps about six months ago. Could RRD still be holding onto the 40Gbps limit somewhere causing this?

Checked polling performance and it looks like it’s able to finish ~60-80 seconds, which is within the 5 minute interval. I know 60-80 seconds isn’t the greatest, but has been that way for 6 years with no issues.
Any other ideas of what to check? I’m at a loss right now of what to check.
EDIT: I enabled RRD Tune on the interface today to see if that helps. Never had to enable it before, so unsure it will help.