Hi Community,
since Update to LibreNMS Version "1.54-64-ga0ba412d6" we recognize a not proper working of Dashboard graphs with variable timeframe (24h ago, 48h ago, 1 week ago…). All graphs shows still the same time range beginning from midnight and not the requested timeframe which is handover in URL (lazy_w=552&from=end-24h)
URLs:
**24h**: https://librenms/graph.php?device=1&type=service_graph&id=95&ds=uptime&lazy_w=552&from=end-24h&legend=yes&width=@AUTO_WIDTH@&height=@AUTO_HEIGHT@
**48h**: https://librenms/graph.php?device=1&type=service_graph&id=95&ds=uptime&lazy_w=552&from=end-48h&legend=yes&width=@AUTO_WIDTH@&height=@AUTO_HEIGHT@
**last week**: https://librenms/graph.php?device=1&type=service_graph&id=95&ds=uptime&lazy_w=552&from=end-168h&legend=yes&width=@AUTO_WIDTH@&height=@AUTO_HEIGHT@
**last month**: https://librenms/graph.php?device=1&type=service_graph&id=95&ds=uptime&lazy_w=552&from=end-1m&legend=yes&width=@AUTO_WIDTH@&height=@AUTO_HEIGHT@
Graphs still shows the same time frame:
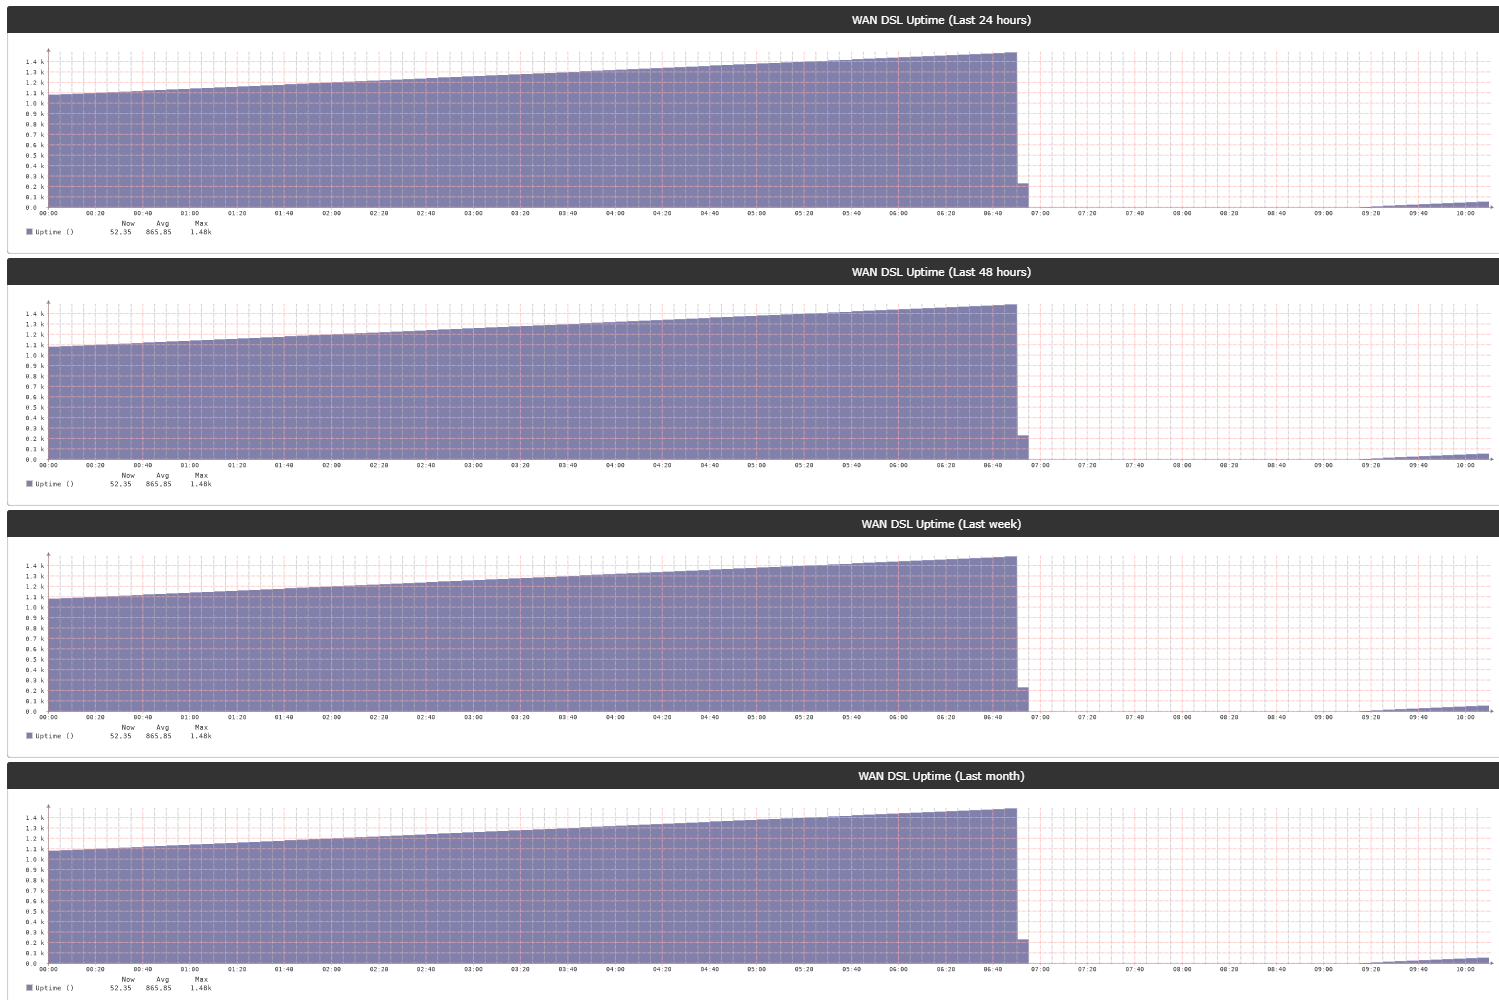
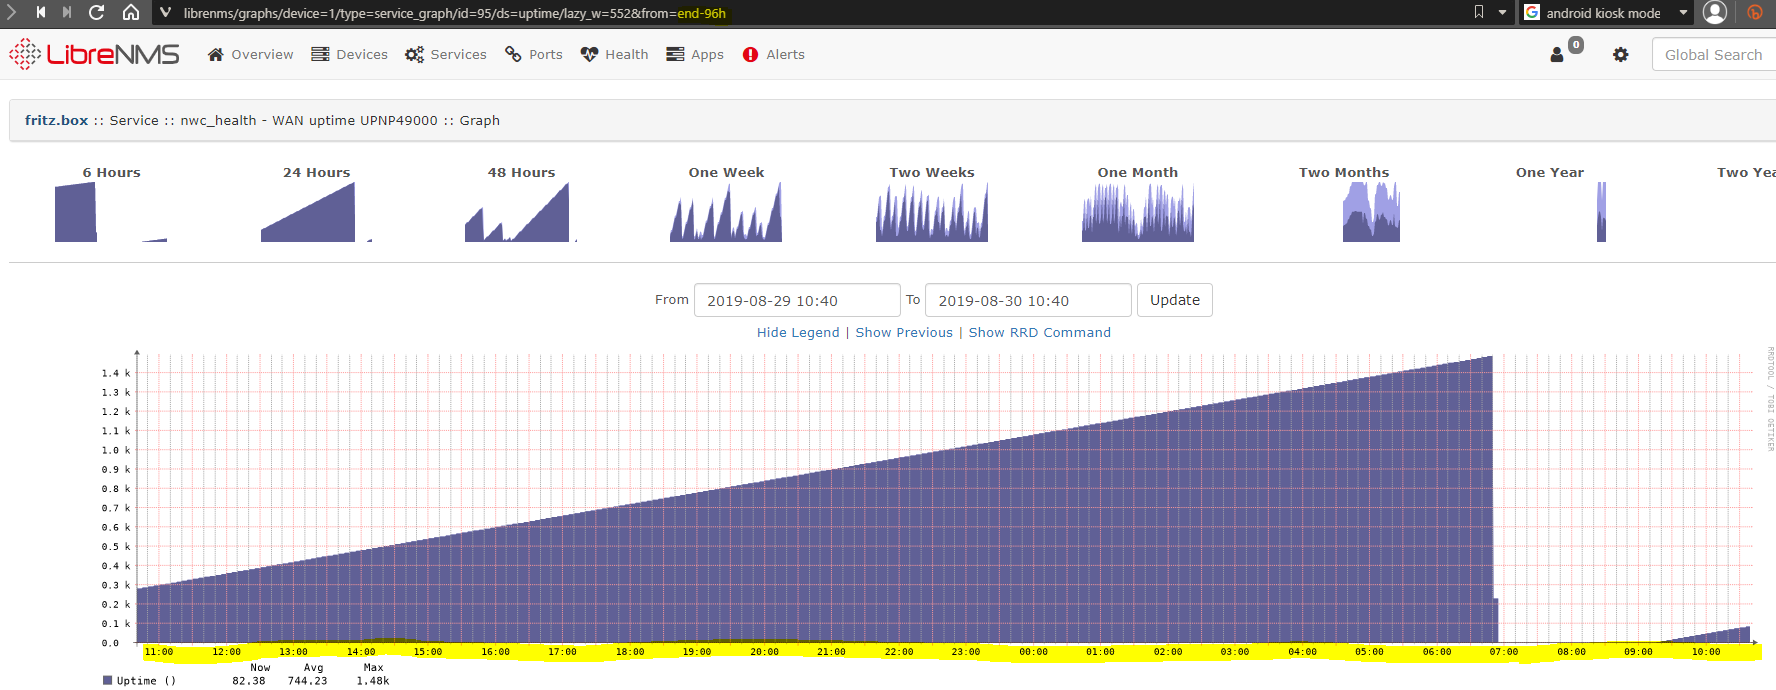
When I use absolute time ranges (fix time range) then it shows me the correct time frame:
URLs:
> **6h**:https://librenms/graphs/device=1/type=service_graph/id=95/ds=uptime/from=1567132200/to=1567153800/
> **24h**:https://librenms/graphs/device=1/type=service_graph/id=95/ds=uptime/from=1567067400/to=1567153800/
> **48h**:https://librenms/graphs/device=1/type=service_graph/id=95/ds=uptime/from=1566981000/to=1567153800/
> ...

When I change the time frame in URL from absolute e.g. “from=1566981000/to=1567153800/” range to variable e.g. 96h “lazy_w=552&from=end-96h” it still shows me only the last 24h instead of requested 96h.
The same happens for all graphs in LibreNMS Android App (IOS not tested)
Here an example for CPU processor graph and Poller graph:
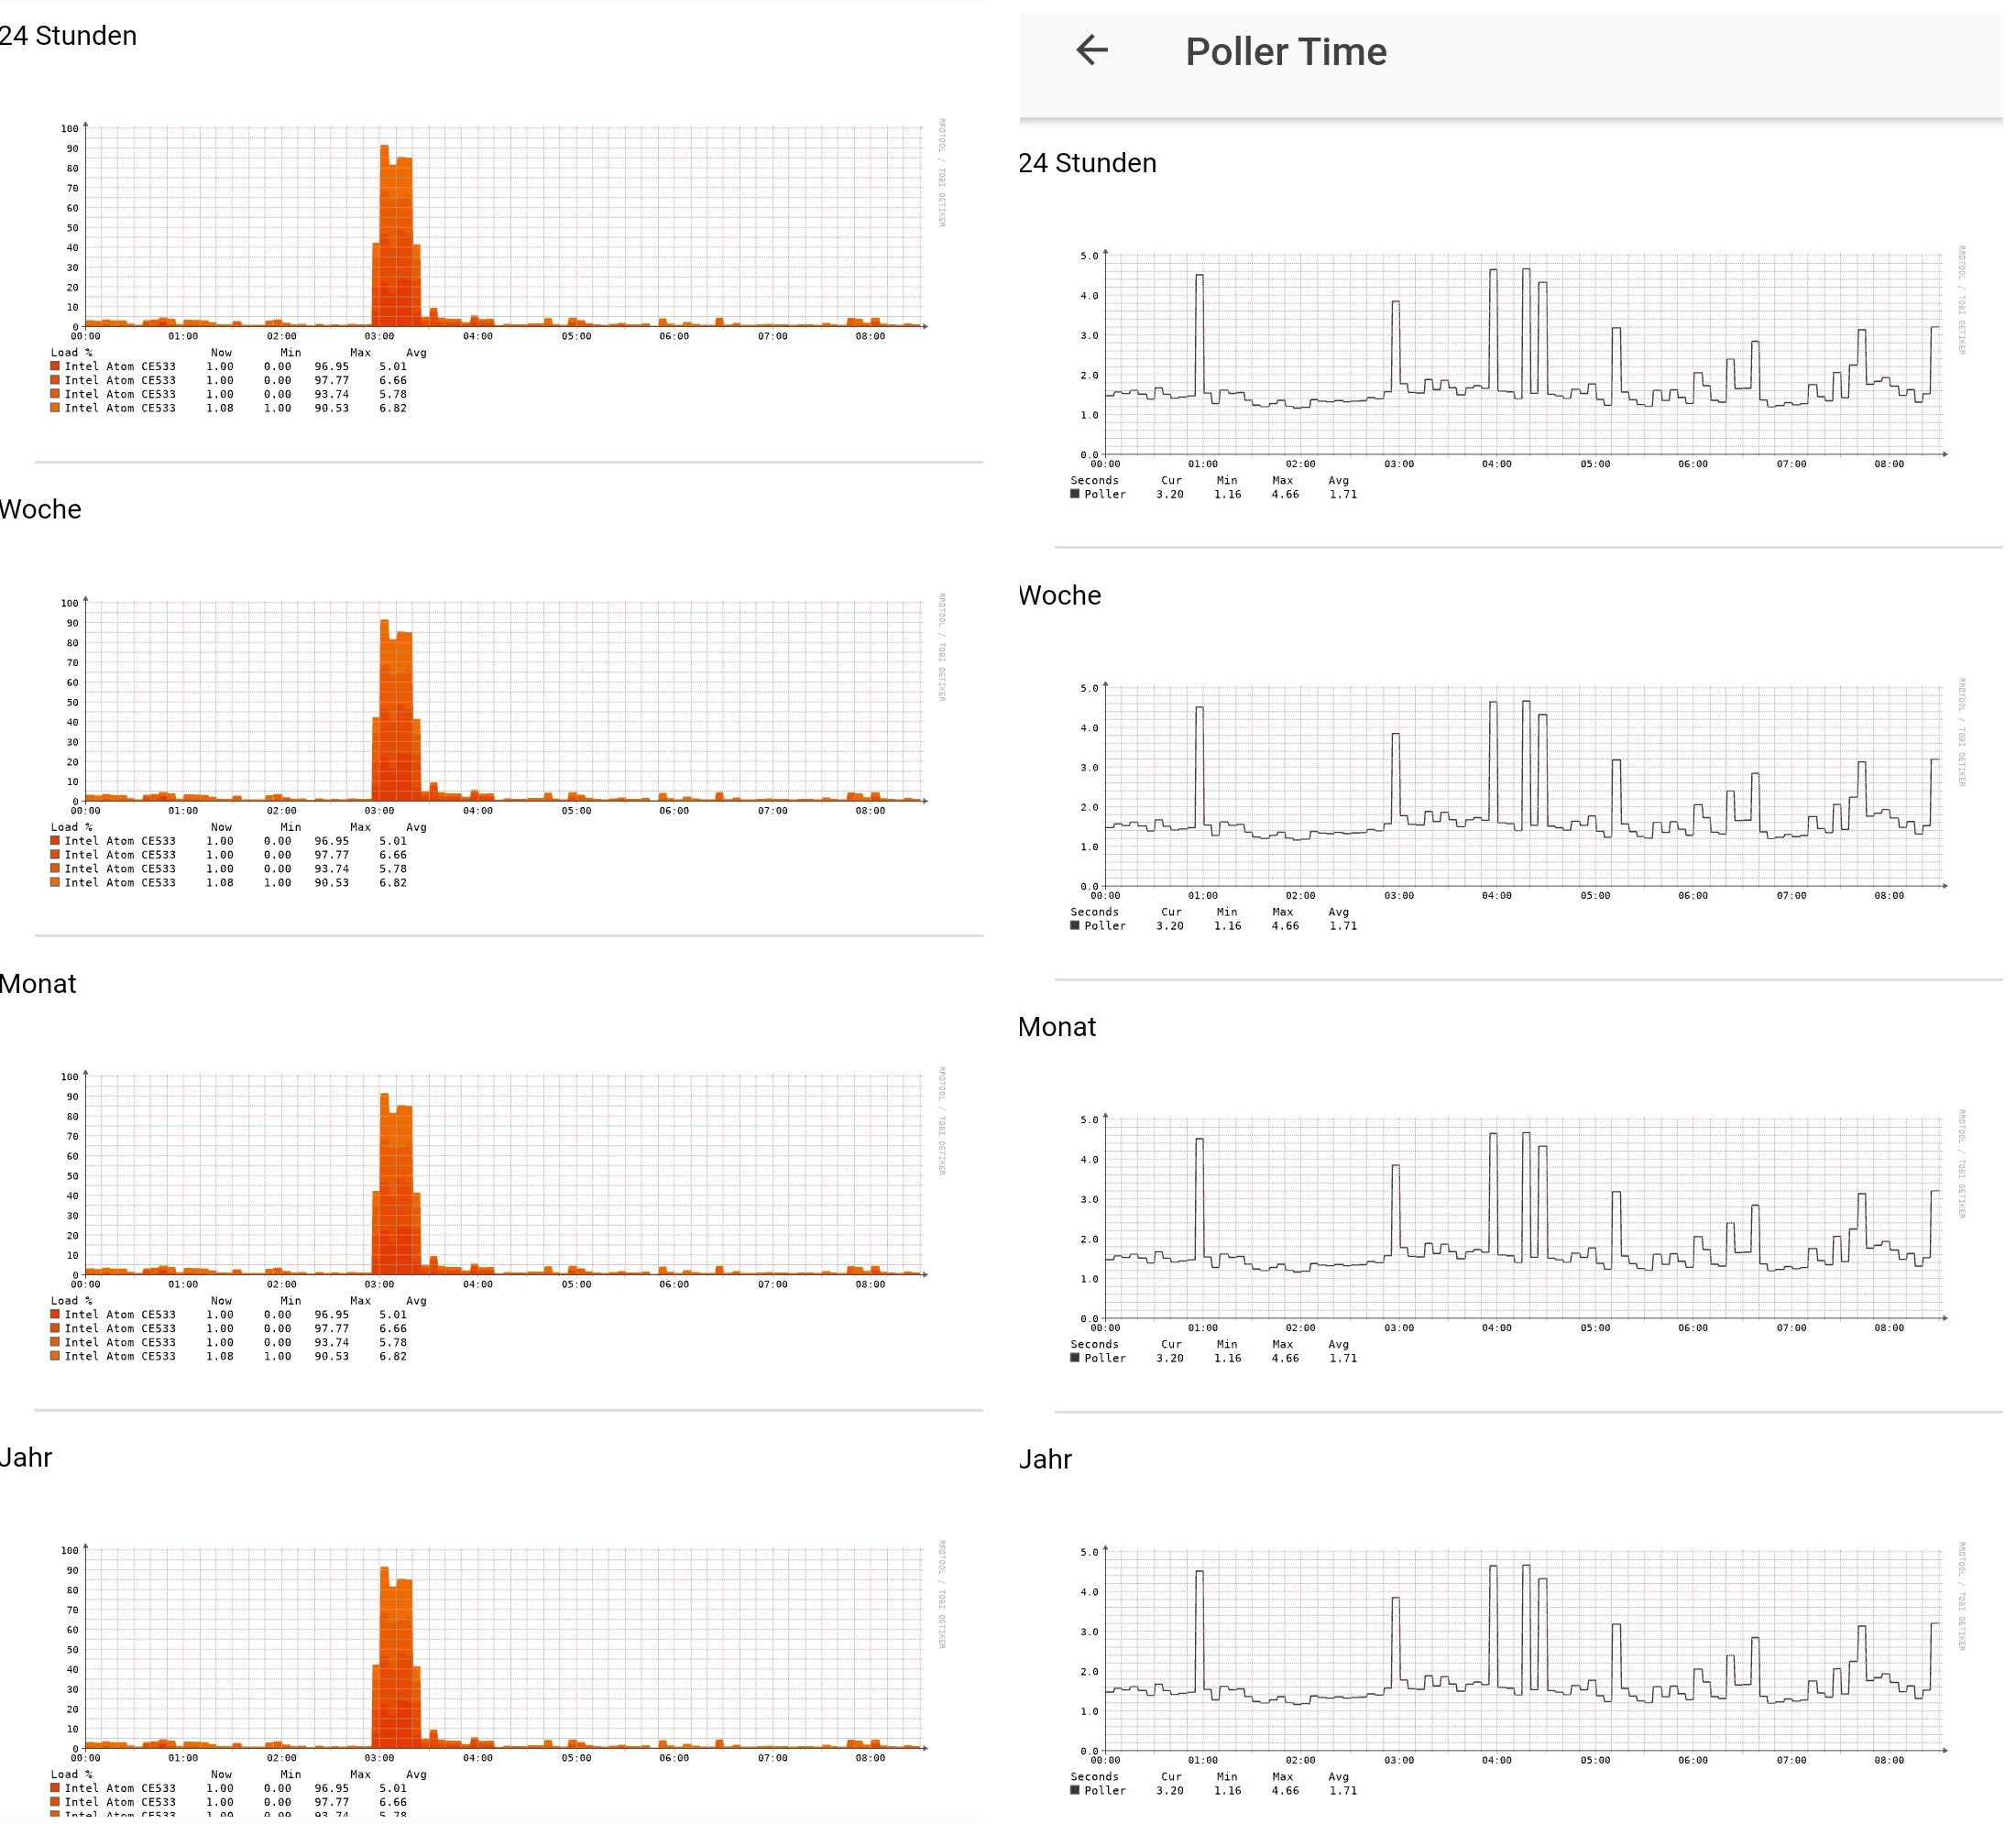
All graphs shows still the same time frame. ![]()
I guess it happens since last version update to "1.54-64-ga0ba412d6" and it was never seen before in older version “1.53.1-58-g5400a908f”
Here my validate output:
| Component | Version |
|---|---|
| LibreNMS | 1.54-64-ga0ba412d6 |
| DB Schema | 2019_07_09_150217_update_users_widgets_settings (140) |
| PHP | 7.2.9-1+b2 |
| MySQL | 10.3.15-MariaDB-1 |
| RRDTool | 1.7.1 |
| SNMP | NET-SNMP 5.7.3 |
Can you please investigate that and fix that to make it working as before in the last update.
Thanks in advance,
Chris,