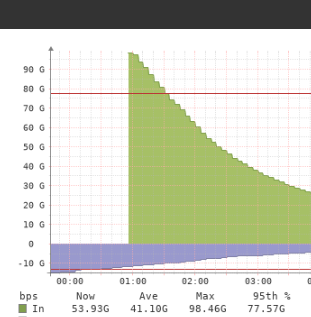
RRD graphs in aggregated (LACP) interfaces get broken when the counter exceeds the value of one interface. For instance, if two 100G ethernet ifces comprise an aggregated interface and the traffic exceeds 100G then RRDs stop getting graphed. See the attached image. This happens to a Juniper MX router if that relates somehow. Have enabled the feature to “Tune all rrd port files to use max values” but I don’t see any difference. Any ideas?
We do not have the autotune setup … but I have noticed I also don’t have any data since despite this change - I will see how it looks in a few hours.
It would be interesting to see what your MAX figures are on the appropriate RRD file.
It would be interesting to know if you are polling on a different host via rrdcached which may have an issue … see Issue with RRD tuning over rrdcached
Indeed, I have the same issue. I checked with rrdinfo and the max value is set to 100Gbps instead of 200. I have tuned it with tune_port.php and will be waiting a few hours to check the result and update you.