Running through agent or snmp extend

Hi,

Just to try and understand LibreNMS better.

I’ve implemented memcached monitoring via the agent installed on a Linux server.

This resides in:

/usr/lib/check_mk_agent/local/memcached

Does the agent know that whenever a script is in there to call it? after enabling in the web interface under applications?

Do I also need to make this script accessible from snmpd.conf like so:

extend memcached /usr/lib/check_mk_agent/local/memcached

?

Please advise, as I believe both are mutually exclusive ie. either do it via the agent or via snmp extend, but not both.

Michael.

After install the agent/application monitor on the host you will need to then
enable it for that device in the Web UI go to Gear>Edit>Applications

Then also make sure you have enable the agent in Edit>Modules

SNMP Extend

Copy the memcached script to /etc/snmp/ on your remote server.

Make the script executable: chmod +x /etc/snmp/memcached

Edit your snmpd.conf file (usually /etc/snmp/snmpd.conf) and add:

extend memcached /etc/snmp/memcached

Hi Kevin,

Thank you, I’ve done that and will check over the next 10-15 minutes for results.

More so, my question relates to the difference between agent and snmp.

For the apache and mysql for example, when adding the Linux server, I installed the agent, enabled the unix agent in the modules section.

I then put both apache and mysql scripts into:

/usr/lib/check_mk_agent/local/

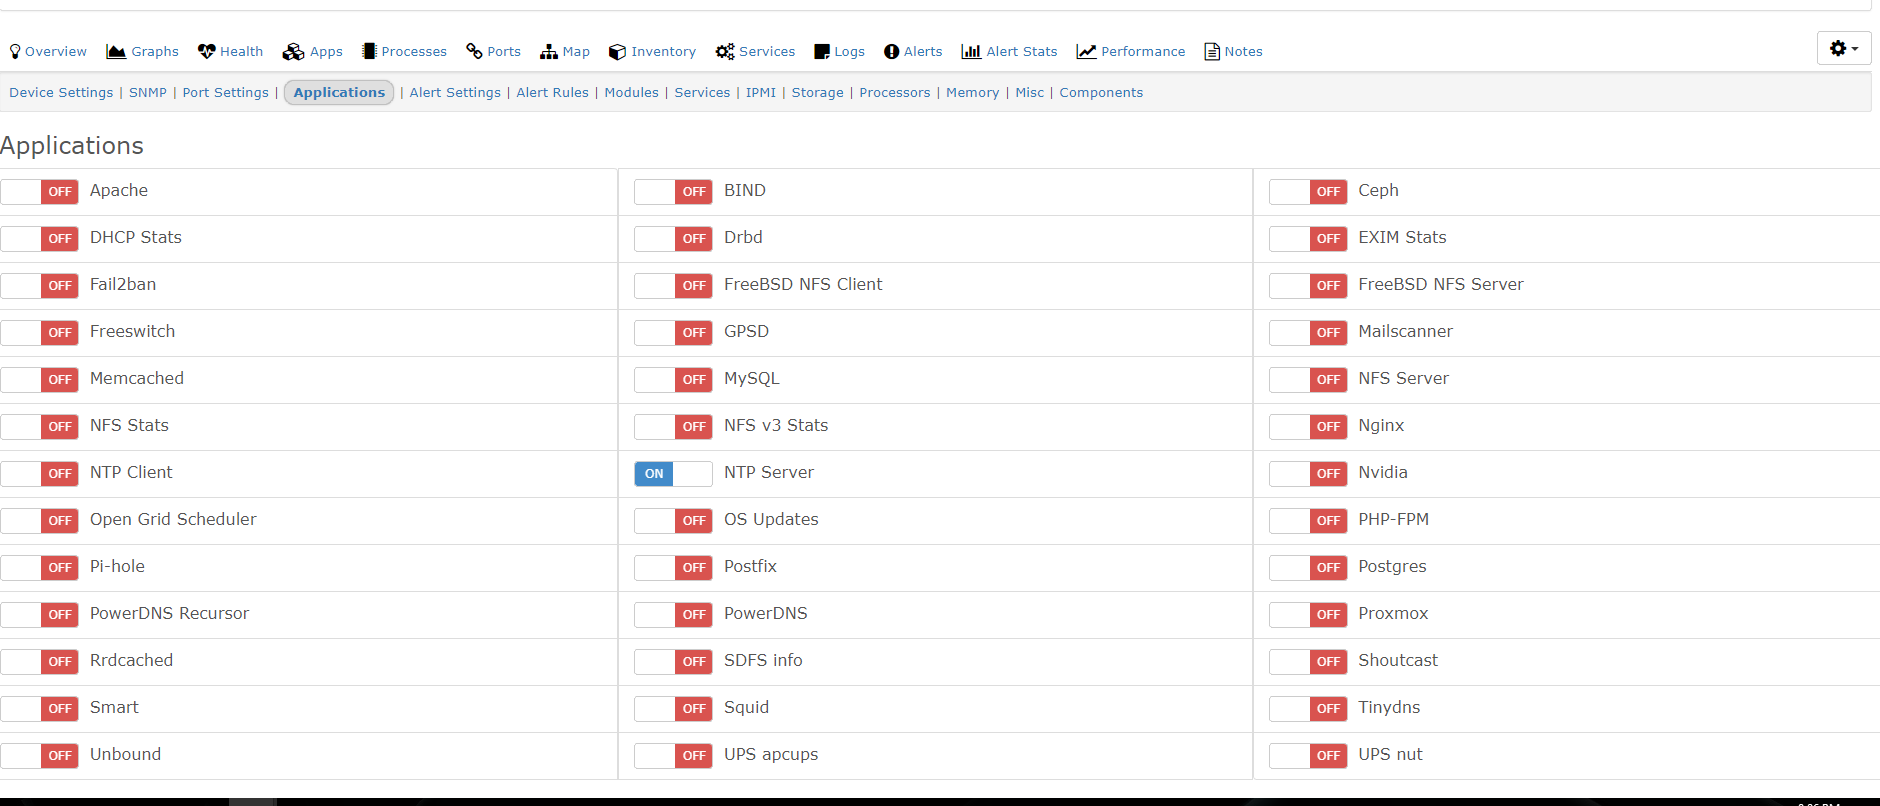
and enabled them in the “application” section, then they started graphing. I didn’t use snmp extend for either apache or mysql, just let it go through the unix agent.

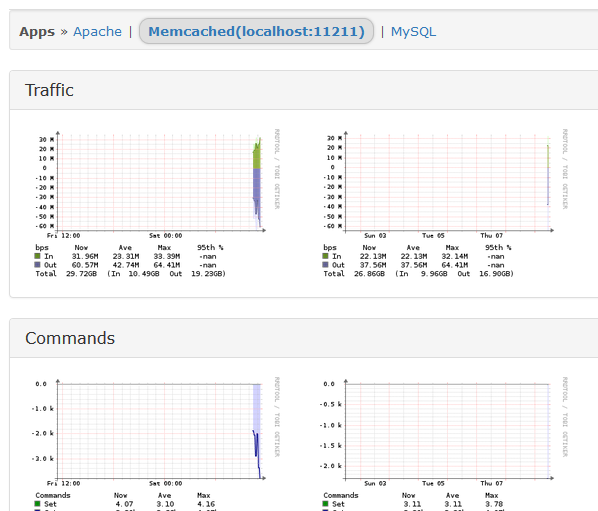
I did the same with memcached, but nan’s in the graph were present waiting over 30 minutes, even though the script works fine when run manually from the server.

I then thought maybe it needs to run through snmp (because the online docs just show the snmp example), which is why I then used snmp for it.

So my question is, do we use either the agent way, or the snmp extend way, or do we use both (or does both break things)?

Please advise. Thank you.

Michael.

I guess it depends on what Application you are monitoring some are through the agent and some are done through SNMP extend.

I don’t think if use both it will break anything. :wink:

Hi Kevin. For whatever reason, the memcached isn’t graphing.

Tried with both agent and snmp extend.

Running the script manually from the server works fine.

Any ideas on how to trouble-shoot this one?

Thanks.

Michael.

First thing I would do, check the firewall on that device.
Also did you follow the doc for memcached?
https://docs.librenms.org/Extensions/Applications/#memcached

Hi Kevin. Yeah I whitelisted the librenms server on the hosts, so basically it can do whatever it wants through the firewall.

Remember that apache and mysql are graphing properly from the host to librenms, using the agent.

The host is also graphing properly all CPU’s, memory, etc for the host to librenms via snmp.

The only graphing I’m not getting is the memcached one.

Running manually on the host is fine:

/usr/lib/check_mk_agent/local/memcached

<<<app-memcached>>>
a:1:{s:15:"localhost:11211";a:24:{s:3:"pid";i:2427;s:6:"uptime";i:588215;s:7:"threads";i:4;s:4:"time";i:1504833897;s:12:"pointer_size";i:64;s:19:"rusage_user_seconds";i:6726;s:24:"rusage_user_microseconds";i:729381;s:21:"rusage_system_seconds";i:18783;s:26:"rusage_system_microseconds";i:104534;s:10:"curr_items";i:735753;s:11:"total_items";i:2130850;s:14:"limit_maxbytes";i:1585446912;s:16:"curr_connections";i:10;s:17:"total_connections";i:292453;s:21:"connection_structures";i:42;s:5:"bytes";i:348912192;s:7:"cmd_get";i:796861587;s:7:"cmd_set";i:2468097;s:8:"get_hits";i:728532705;s:10:"get_misses";i:68328882;s:9:"evictions";i:0;s:10:"bytes_read";i:164189614314;s:13:"bytes_written";i:213496436264;s:7:"version";s:6:"1.4.24";}}

Same script is in /etc/snmp and ran from there too just fine.

Michael.

Have you tried restarting snmp on that Linux server?

Yes absolutely.

The script has executable permission to world, so the agent and the snmp user would have access to it.

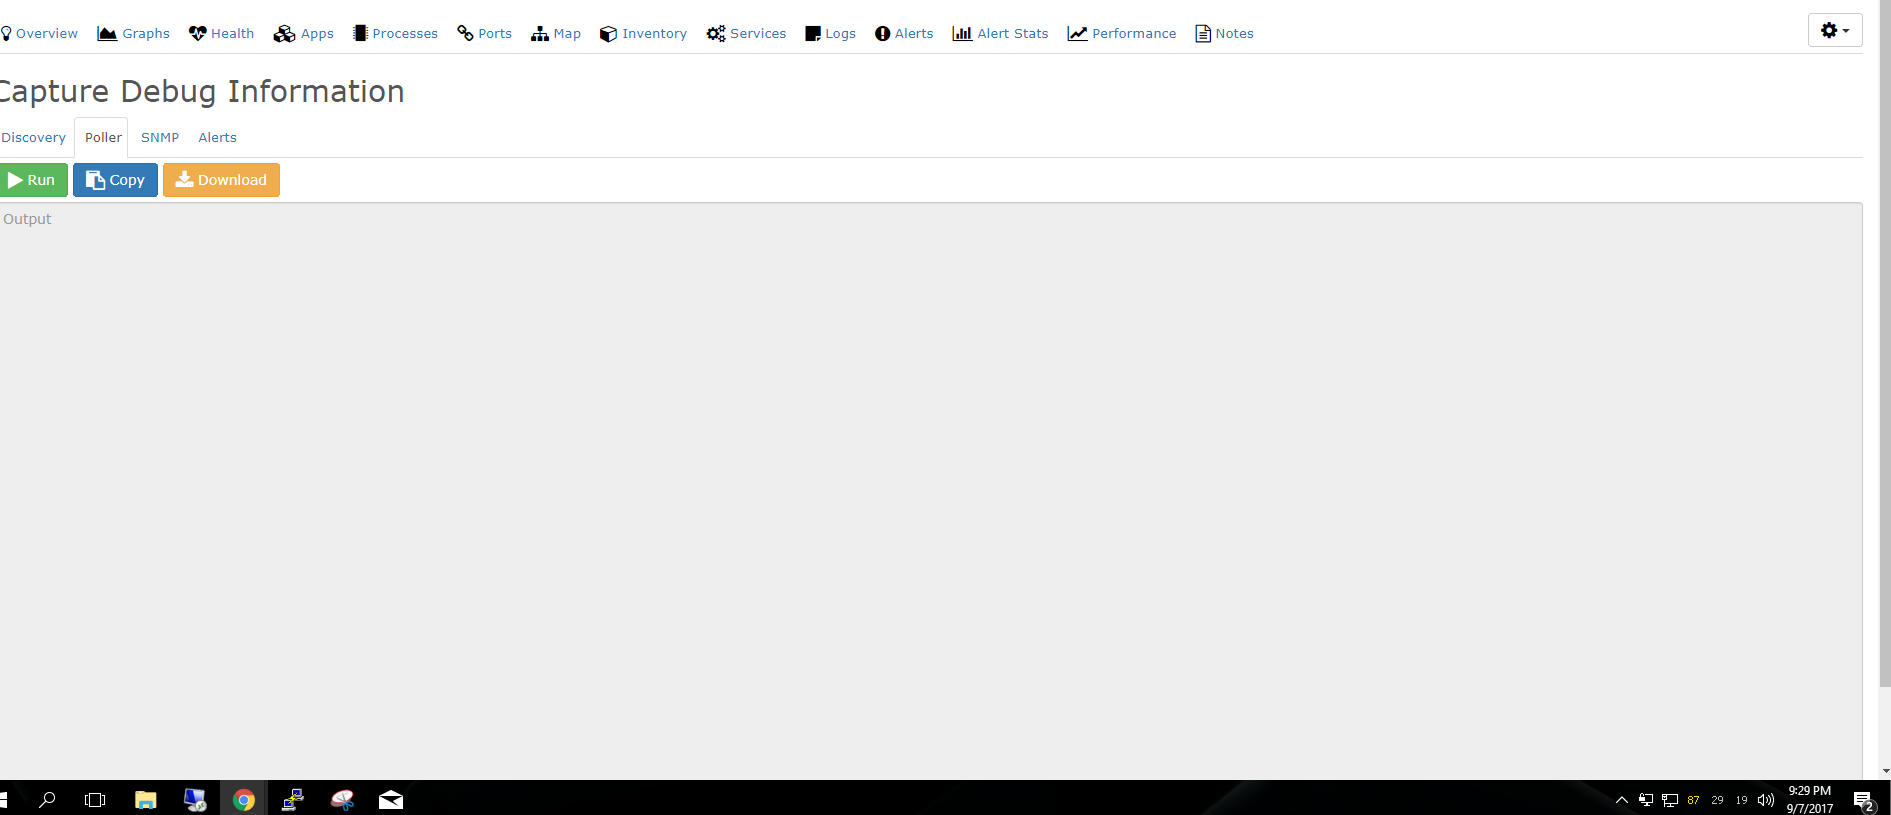
Isn’t there any logs for the poller I could look at?

I have run the poller manually with debug also, but don’t see anything in the output to indicate any problems (even though I don’t see apache, mysql, etc in there, I do see sections for “Start Alerts” etc.

If there was a log I could look at it would guide the way to the problem.

Michael.

you can check in here logs/librenms.log

Did you try the debug in the web ui?

Thanks, I’ve checked there and can’t see anything amiss.

No, I tried from the ./poller with -d.

Wow, I hunted around and found the option in the GUI, ran it, downloaded and viewed in Notepad++. What a wealth of information in there, but I can’t see where things are going wrong.

I can see this part:

>> Runtime for poller module 'entity-physical': 0.0006 seconds with 960 bytes
#### Unload poller module entity-physical ####

RRD[update host.example.com/poller-perf-entity-physical.rrd N:0.00064492225646973 --daemon unix:/var/run/rrdcached/rrdcached.sock]
[RRD Disabled]Modules status: Global+ OS  Device  
#### Load poller module applications ####
SQL[SELECT * FROM `applications` WHERE `device_id`  = '10'] 
 apacheRRD[update host.example.com/app-apache-12.rrd N:7895:27183104:.770683:10383:.760378:2618.04:3443.08:U:U:3:0:1:3:14:0:0:0:0:0:235 --daemon unix:/var/run/rrdcached/rrdcached.sock]
[RRD Disabled]SQL[UPDATE `applications` set `app_state` ='UNKNOWN',`app_status` ='',`timestamp` =NOW() WHERE `app_id` = '13'] 
 memcached()RRD[update host.example.com/app-memcached-13.rrd N:U:U:U:U:U:U:U:U:U:U:U:U:U:U:U:U:U:U --daemon unix:/var/run/rrdcached/rrdcached.sock]
[RRD Disabled]SQL[UPDATE `applications` set `app_state` ='OK',`app_status` ='',`timestamp` =NOW() WHERE `app_id` = '57'] 
 mysqlRRD[update host.example.com/app-mysql-57.rrd N:8388608:U:U:635867845:849306:13201:1848207:U:U:U:1719867:107316:10235656:22267569754:941150:660887:321390:3486350:31552972:1555:65536:64170:35:54:684:178:684:18176:0:0:0:33554432:33536864:500:35:607:0:4:401719:U:709585186:45024:141061830:1551584:0:0:0:27473281:0:3477116:8418489:26408:U:U:U:U:U:U:0:U:0:0:133:14:1857288:0:16618010:57:7802552027:197684008212:59234:768269:7670:2607:92286:0:27475471:860985:330 --daemon unix:/var/run/rrdcached/rrdcached.sock]
[RRD Disabled]RRD[update host.example.com/app-mysql-57-status.rrd N:U:U:U:U:U:U:U:U:U:U:U:U:U:U:U:1 --daemon unix:/var/run/rrdcached/rrdcached.sock]
[RRD Disabled]

>> Runtime for poller module 'applications': 0.0051 seconds with 67312 bytes
#### Unload poller module applications ####

which tells me it should be putting stuff in there but there’s also parts of “U:U:U” etc…

Not sure why it’s failing.

Michael.

When I perform the SNMP run I get:

.1.3.6.1.4.1.8072.1.3.2.3.1.1.9.109.101.109.99.97.99.104.101.100 = STRING: <<<app-memcached>>>
.1.3.6.1.4.1.8072.1.3.2.3.1.2.9.109.101.109.99.97.99.104.101.100 = STRING: <<<app-memcached>>>
a:1:{s:15:\"localhost:11211\";a:24:{s:3:\"pid\";i:2427;s:6:\"uptime\";i:598151;s:7:\"threads\";i:4;s:4:\"time\";i:1504843833;s:12:\"pointer_size\";i:64;s:19:\"rusage_user_seconds\";i:6743;s:24:\"rusage_user_microseconds\";i:552824;s:21:\"rusage_system_seconds\";i:18809;s:26:\"rusage_system_microseconds\";i:375540;s:10:\"curr_items\";i:737615;s:11:\"total_items\";i:2147304;s:14:\"limit_maxbytes\";i:1585446912;s:16:\"curr_connections\";i:12;s:17:\"total_connections\";i:295892;s:21:\"connection_structures\";i:42;s:5:\"bytes\";i:349714259;s:7:\"cmd_get\";i:797817831;s:7:\"cmd_set\";i:2485770;s:8:\"get_hits\";i:729474718;s:10:\"get_misses\";i:68343113;s:9:\"evictions\";i:0;s:10:\"bytes_read\";i:165356202913;s:13:\"bytes_written\";i:214157527932;s:7:\"version\";s:6:\"1.4.24\";}}
.1.3.6.1.4.1.8072.1.3.2.3.1.3.9.109.101.109.99.97.99.104.101.100 = INTEGER: 2
.1.3.6.1.4.1.8072.1.3.2.3.1.4.9.109.101.109.99.97.99.104.101.100 = INTEGER: 0
.1.3.6.1.4.1.8072.1.3.2.4.1.2.9.109.101.109.99.97.99.104.101.100.1 = STRING: <<<app-memcached>>>
.1.3.6.1.4.1.8072.1.3.2.4.1.2.9.109.101.109.99.97.99.104.101.100.2 = STRING: a:1:{s:15:\"localhost:11211\";a:24:{s:3:\"pid\";i:2427;s:6:\"uptime\";i:598151;s:7:\"threads\";i:4;s:4:\"time\";i:1504843833;s:12:\"pointer_size\";i:64;s:19:\"rusage_user_seconds\";i:6743;s:24:\"rusage_user_microseconds\";i:552824;s:21:\"rusage_system_seconds\";i:18809;s:26:\"rusage_system_microseconds\";i:375540;s:10:\"curr_items\";i:737615;s:11:\"total_items\";i:2147304;s:14:\"limit_maxbytes\";i:1585446912;s:16:\"curr_connections\";i:12;s:17:\"total_connections\";i:295892;s:21:\"connection_structures\";i:42;s:5:\"bytes\";i:349714259;s:7:\"cmd_get\";i:797817831;s:7:\"cmd_set\";i:2485770;s:8:\"get_hits\";i:729474718;s:10:\"get_misses\";i:68343113;s:9:\"evictions\";i:0;s:10:\"bytes_read\";i:165356202913;s:13:\"bytes_written\";i:214157527932;s:7:\"version\";s:6:\"1.4.24\";}}

That looks like an issue with snmpd, can you share your net-snmp config?

My snmpd.conf file (it’s from a CentOS 6 server):

# cat /etc/snmp/snmpd.conf
# Change RANDOMSTRINGGOESHERE to your preferred SNMP community string
com2sec readonly  default         somestring

group MyROGroup v2c        readonly
view all    included  .1                               80
access MyROGroup ""      any       noauth    exact  all    none   none

syslocation Some location
syscontact Some Name <[email protected]>

#Distro Detection
extend .1.3.6.1.4.1.2021.7890.1 distro /usr/bin/distro

#If you have 'dmidecode' installed on your host, you can add the following lines for additional hardware detection
#extend .1.3.6.1.4.1.2021.7890.2 hardware '/usr/sbin/dmidecode -s system-product-name'
#extend .1.3.6.1.4.1.2021.7890.3 manufacturer '/usr/sbin/dmidecode -s system-manufacturer'
#extend .1.3.6.1.4.1.2021.7890.4 serial '/usr/sbin/dmidecode -s system-serial-number'

extend memcached /etc/snmp/memcached

Centos 6 issue? Maybe update to centos 7.

Also, have you checked SELinux?

That looks ok. The issue I see is that your getting multiple responses back for the same OID according to your output :frowning:

Hi Team. Very strange, I got it to work by:

  1. removing the memcached script : /opt/librenms-agent/agent-local/memcached

  2. turning off the memecached application in the web interface

  3. waiting for some polls

  4. going back to the web interface to turn on the memcached application, only to find it’s on (no idea why)

  5. going to the web interface and seeing the graphs:

The difference being, it now shows the localhost:11211

No idea why but this is strange…

Michael.