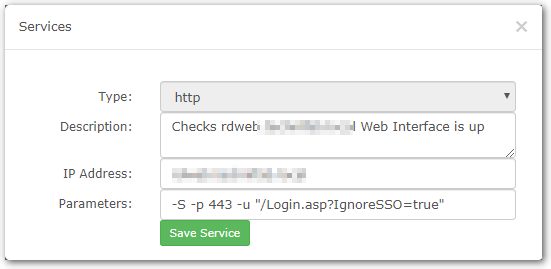
I setup some of the nagios services one checks if an http site is up. Data is returned and the rrd files exist and are owned by librenms but my graphs are blank and show -nan. All of the services look like this not just one.

RRDTool Command

rrdtool graph /tmp/iHoxnQb9lYs7a02u  --alt-autoscale-max --rigid -E --start 1556564700 --end 1556651100 --width 1919.7 --height 543 -c BACK#EEEEEE00 -c SHADEA#EEEEEE00 -c SHADEB#EEEEEE00 -c CANVAS#FFFFFF00 -c GRID#a5a5a5 -c MGRID#FF9999 -c FRAME#5e5e5e -c ARROW#5e5e5e -R normal -c FONT#000000 --font LEGEND:8:DejaVuSansMono --font AXIS:7:DejaVuSansMono --font-render-mode normal -l 0 -E  COMMENT:'                      Now     Avg      Max\n' DEF:DS=tf-SERVERNAME/services-17.rrd:time:AVERAGE  DEF:DS_MAX=tf-SERVERNAME/services-17.rrd:time:MAX  AREA:DS_MAX#A0A0E5: AREA:DS#606096:'Time (s)       '  GPRINT:DS:LAST:%5.2lf%s  GPRINT:DS:AVERAGE:%5.2lf%s  GPRINT:DS_MAX:MAX:%5.2lf%s\l  --daemon unix:/var/run/rrdcached.sock
RRDTool Output

2000x612
OK u:0.15 s:0.03 r:0.17
I would expect it to show the service status currently it is 0 but when the site goes down it changes to a 1 or 2. Thanks for reading.
