A Libre installation that has been up and running for not quite two years suddenly has broken SMART graphs. All other graphs seem fine, it is only SMART graphs that are broken. SMART data acquisition is working fine as alerts are still working properly, db data appears up-to-date, and .rrd files are updating. We don’t really watch this server regularly and only check it when it sends a notification about something that needs some attention. SMART has been working just fine for a very long time, then at some point in the past couple months since last checking SMART info when everything was fine the graphs have broken.
Apps > Smart page:
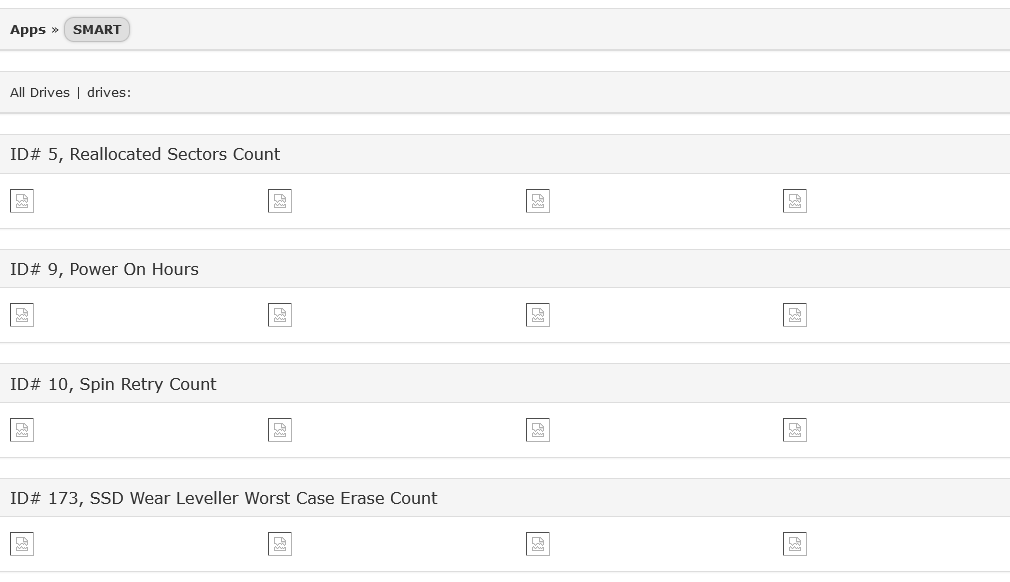
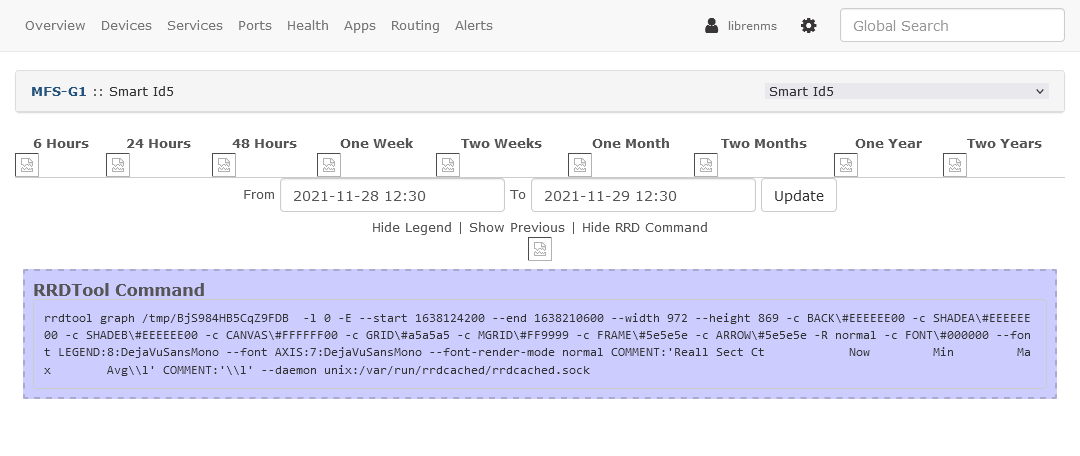
Application page of a particular server:
Nothing has changed in the interim as far as I know.
I have run daily and validate, both with no errors.
[librenms@libre ~]$ ./daily.sh
Fetching new release information                   OK
Updating to latest release                         OK
Updating Composer packages                         OK
Updating SQL-Schema                                OK
Updating submodules                                OK
Cleaning up DB                                     OK
Fetching notifications                             OK
Caching PeeringDB data                             OK
Caching Mac OUI data                               OK
[librenms@libre ~]$ ./validate.php
====================================
Component | Version
--------- | -------
LibreNMS  | 21.11.0
DB Schema | 2021_10_20_224207_increase_length_of_attrib_type_column (224)
PHP       | 7.3.33
Python    | 3.6.8
MySQL     | 10.5.13-MariaDB
RRDTool   | 1.4.8
SNMP      | NET-SNMP 5.7.2
====================================

[OK]    Composer Version: 2.1.12
[OK]    Dependencies up-to-date.
[OK]    Database connection successful
[OK]    Database schema correct
[librenms@libre ~]$
File permissions on the entire librenms directory and subs, including the relevant rrd and php files, are all set to the librenms user.
On one of the monitored servers I have turned off the SMART app, then turned back on again, then waited for some data to roll in. No change, broken graphs. Usually even if there is no data you get a graph with -NaN data, but now I just get broken icons.
I tried toggling the Web UI graph format from png to svg and back to png, but there is no change. All graphs appear good but SMART does not.
Something changed but I’m not clear on what. More to the point I don’t know what would affect SMART graphs only. Lack of data shouldn’t break the graph, but even if it did the alerts are functioning properly and rrd files appear to be updating, demonstrating that lack of data isn’t the issue. I’m at a loss of where to look next.
FYI, SMART was monitoring 15 servers and around 120 disks. The graphs appear to have broken for every single one of them simultaneously.
Problem presents in both FF94 & Chrome96.
Any ideas?