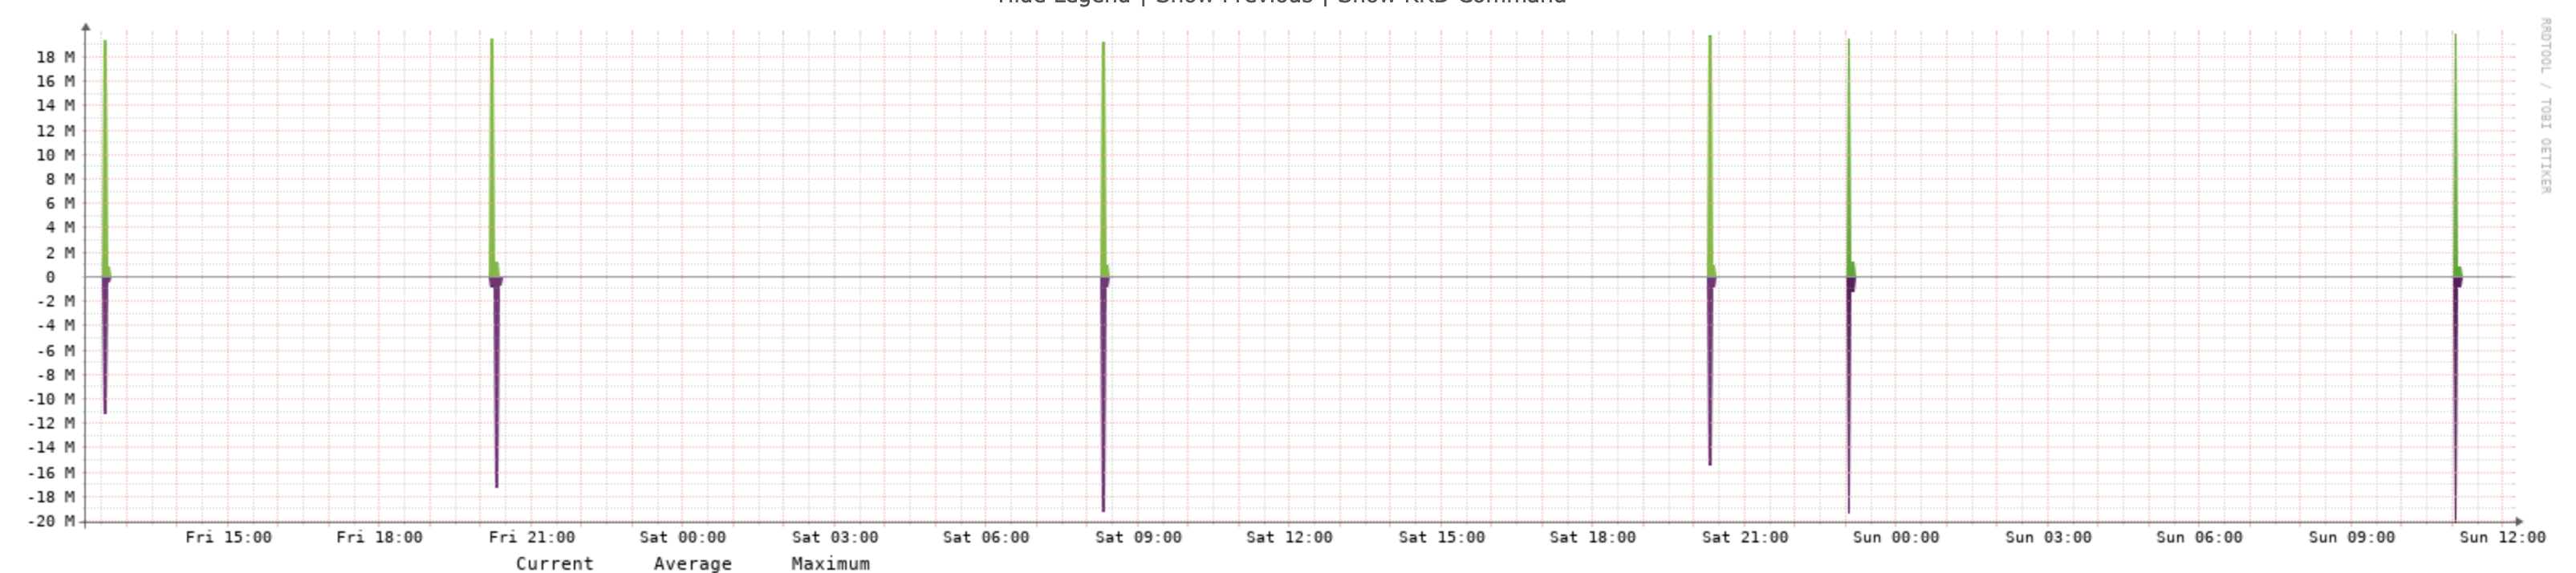
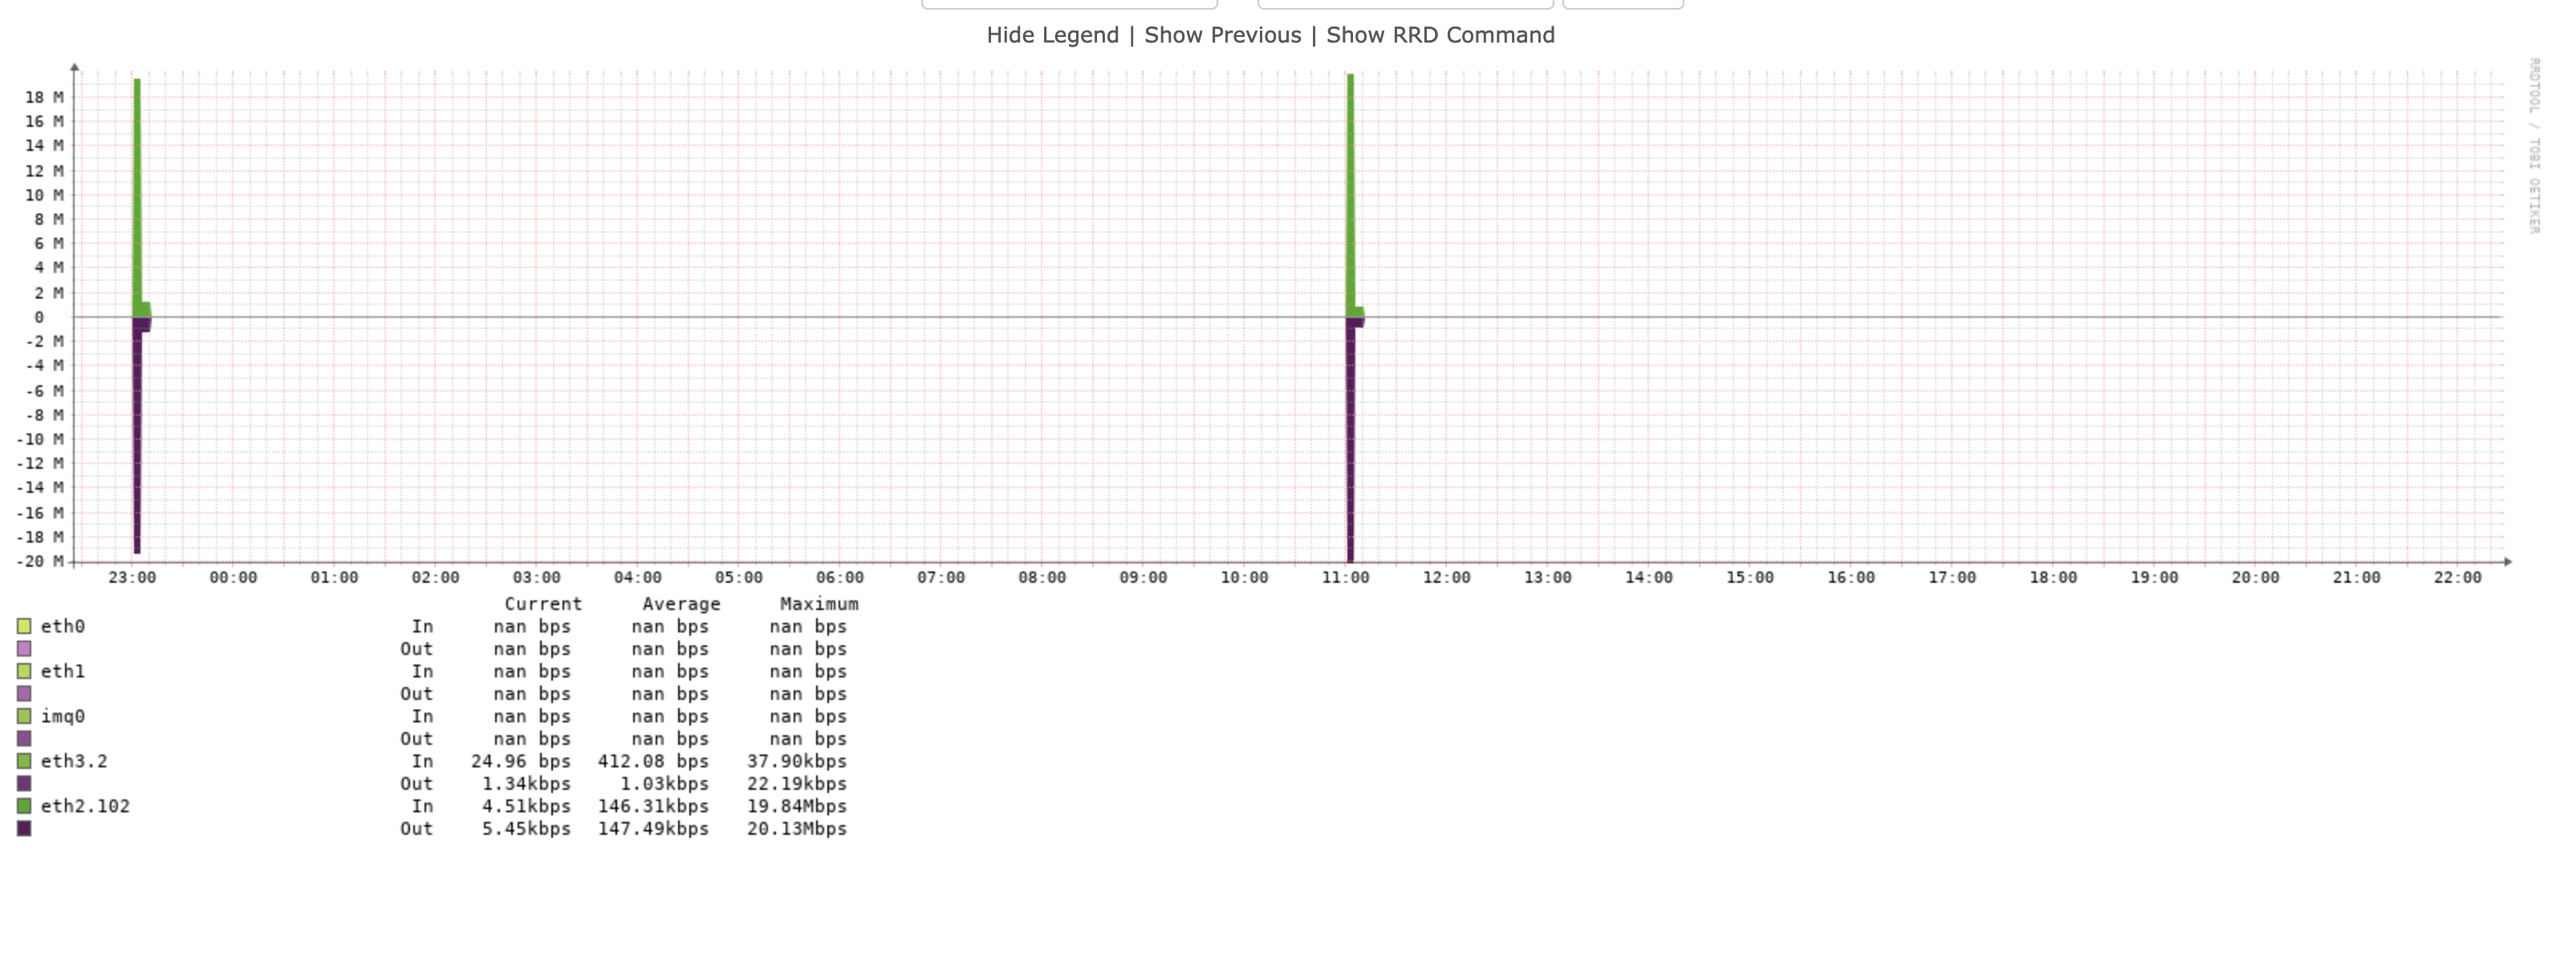
So the last few days graphing of my gateway has somehow stopped. Only shows a few spikes here and there. See image. And I will post a image of the last week as well just to compare normal graphing of the gateway like it used to be.
Last 48h
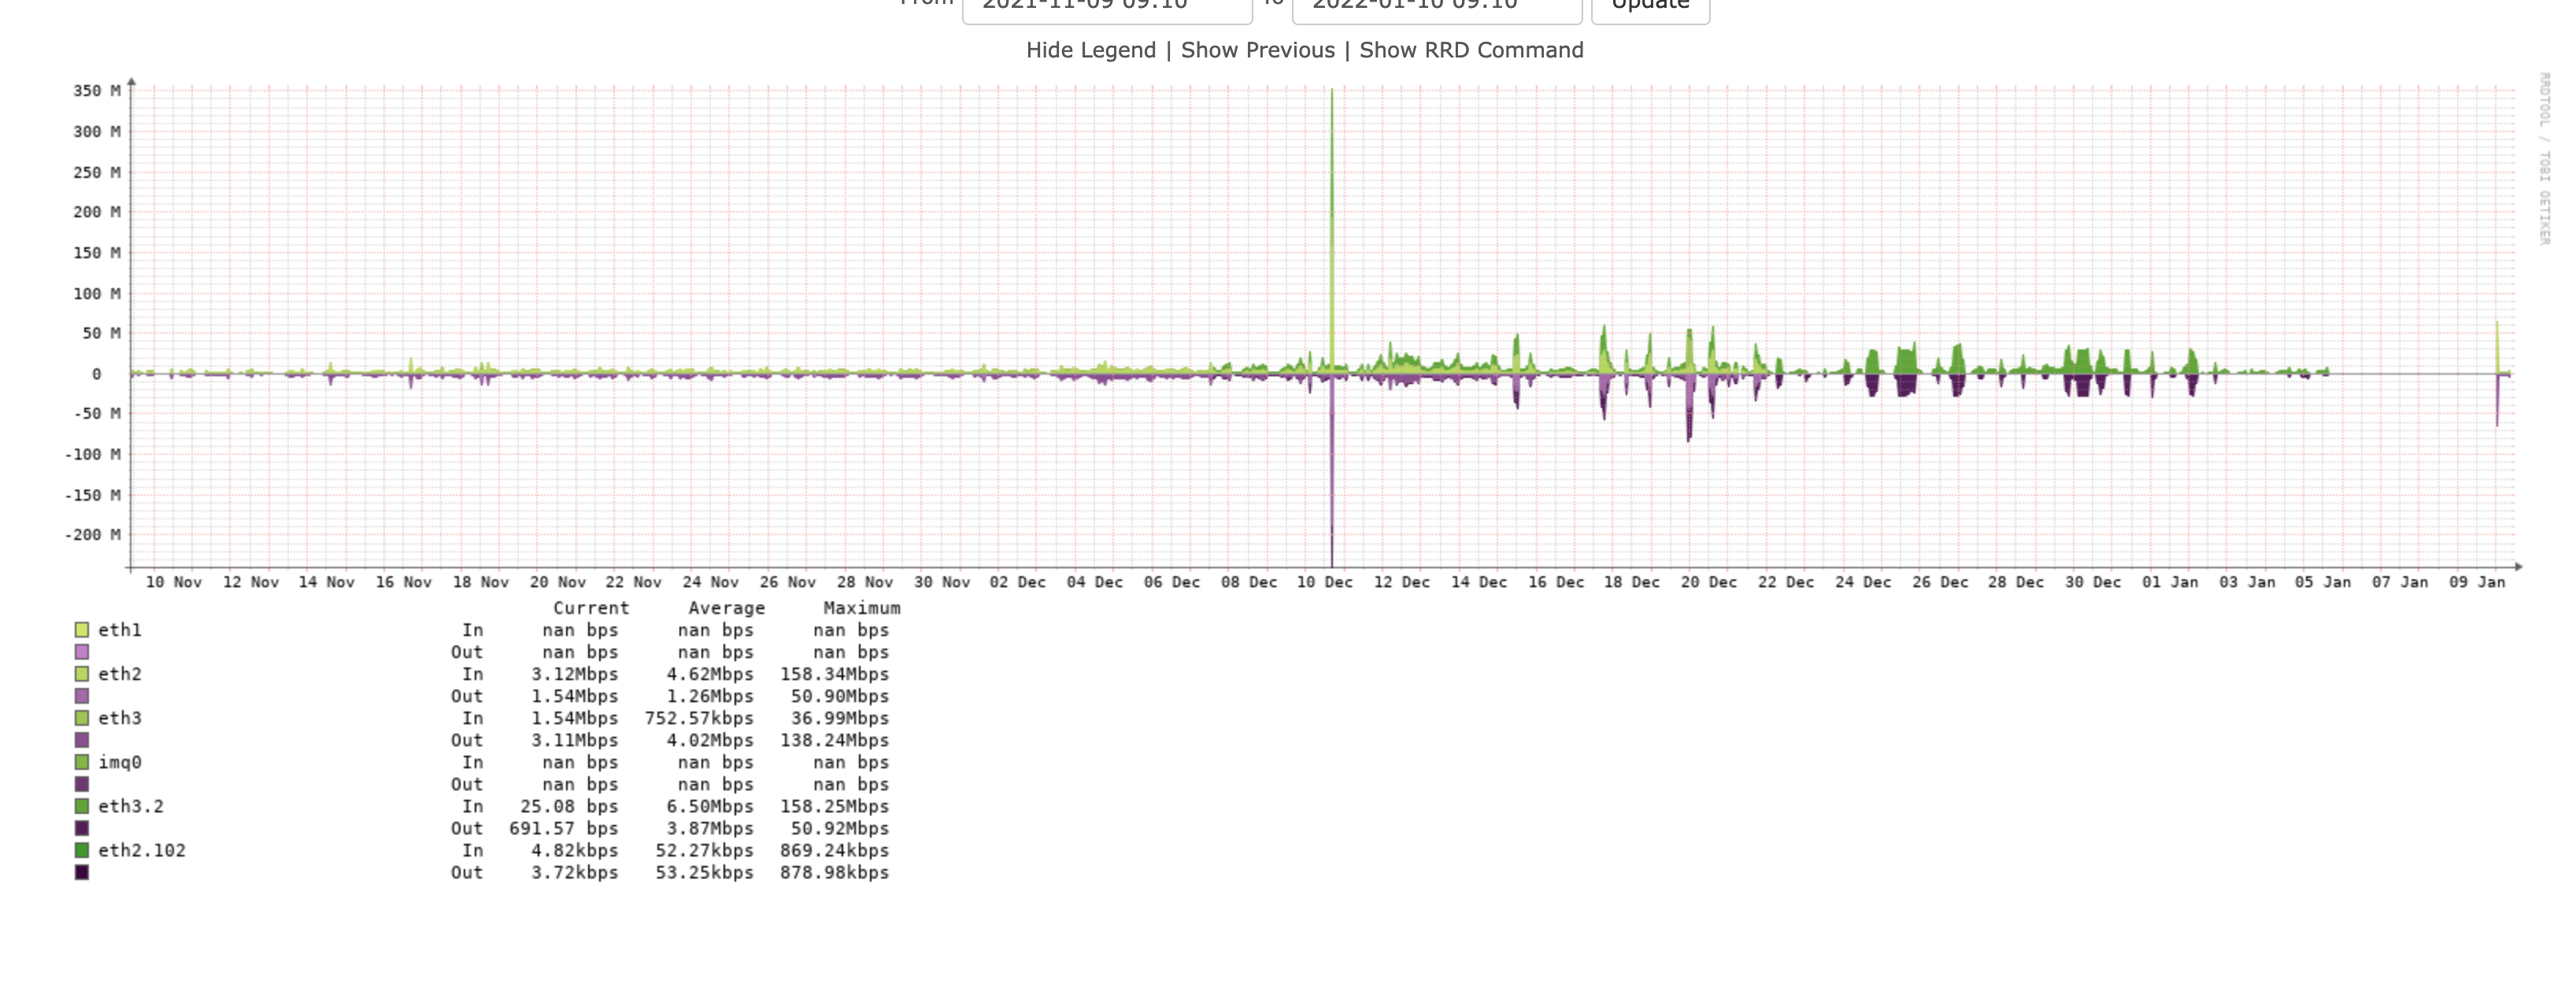
Yeah well, there is really nothing to hide. It’s a gateway. 192.168.1.1 that all my local clients goes through to get online. And as you can see the graphs was a drawn with more details of the traffic for about 7 days ago. And now there is only a few spikes here and there, even if the real traffic is a lot more. (Had 4 10GB wget downloads of test files running randomly without it showing in the gateway graph)
I’m really confused now, but going back in the history of the graphs really skewers the look of things in my opinion. And I guess everything is just fine, but I looks so “naked”, I somehow think there should be more details in the graphs.