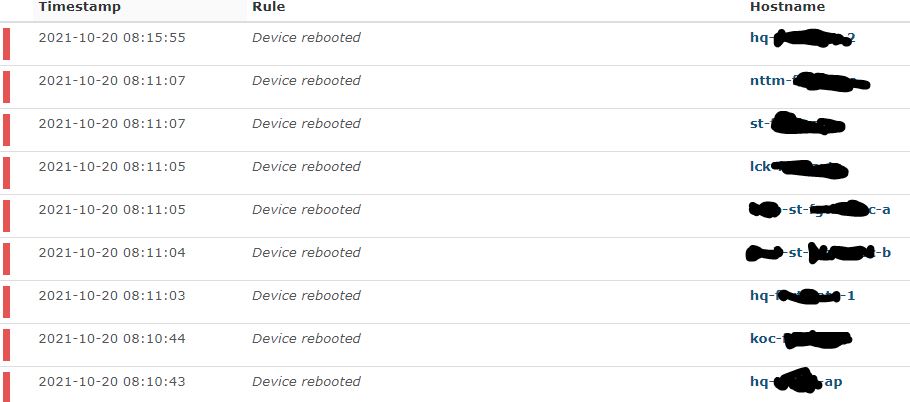
Same here. Since 12:30 am all our Windows servers and most of our switches have bogus uptimes of a few seconds after every poll which has triggered and held the reboot alert active for dozens of devices for the last 6 hours and counting. Uptimes for nearly all our monitored devices are bogus.
I’m aware of the gpsd bug but from what I’ve read it shouldn’t bite until this weekend so I think that’s unrelated.
Will have to wait until I’m in work to analyse what the heck is going on. At first I thought then entire site had a power cut but no UPS alerts made me realise that wasn’t the case.
Voltage and temperature sensor readings from the server LibreNMS runs on are also reporting zero (via SNMP) now setting sensor limit alerts so my guess is there is a major issue with SNMP polling giving incorrect data.
./daily.sh
Updating to latest codebase                        OK
Updating Composer packages                         OK
Updated from f94f7f23b to fdfea6e93                OK
Updating SQL-Schema                                OK
Updating submodules                                OK
Cleaning up DB                                     OK
Fetching notifications                             OK
Caching PeeringDB data                             OK
Caching Mac OUI data                               OK
Same experience as everyone else after auto update to 21.10.0-24-gf94f7f23b.
Running ./daily.sh and waited about 5-10 mins fixed the issue , current version is 21.10.0-27-g6bf706eaa
Further detailing the false reboot event problem, the plain number of seconds shown does accurately reflect the device uptime. However, the friendlier “years, days, hours, minutes, seconds” does not calculate from the plain number of seconds. These two events happened within 30 minutes, but the friendly changed by over one day.
2021-10-20 11:43:18	reboot	10.x.x.x	Device rebooted after 2 years 52 days 9 hours 46 minutes 15 seconds -> 676000s	System
2021-10-20 11:18:52	reboot	10.x.x.x	Device rebooted after 2 years 50 days 17 hours 3 minutes 26 seconds -> 674534s	System
Appears the incorrect friendly reboot is being calculated from the reference field in eventlog, where the reference field is (now) the number of seconds * 100. Looking back to reboot events on October 10th, the reference field was unrelated to the number of seconds.
The problem has been fixed in yesterdays update. (if your current device uptimes look correct it is fixed)
You will still see these bogus reboot entries in the event log - they were calculated and logged while the uptime calculation was incorrect and they will remain in the event log.
If it’s just these historical event log entries you’re worrying about then just ignore them. The fix for the bug that was applied yesterday will not retrospectively remove incorrect event log entries. There’s nothing you can do about them short of editing them out of the database manually.
Yesterday i have the same problem. Many devices, running on windows (7, Server 2012 R2 maybe 10), network devices (Mikrotik SwOS v2.12, SVOS) have uptime from 2 sec to few minutes. But real uptime is few days!
For now i have problem only for Hitachi Storage Virtualization Operating System (SVOS). It showing uptime 2 sec.
But are there any new incorrect Reboot events logged after you updated ?
As I explained, any incorrect reboot events that were logged before the bug was fixed will remain in the event log. The update only fixes the bug, it doesn’t clear out old reboot event log entries that were incorrect.
My apologies, I didn’t realise you’re still seeing new events generated. Now I check I am also seeing one example of this:
2021-10-21 06:35:31 reboot clavius 48 port poe switch 1 Device rebooted after 68 years 35 days 3 hours 13 minutes 47 seconds -> 4295318s
The switch in question is a D-Link DGS-3120-48PC Rev. B1 and has a current listed uptime of 50 days 3 hours 33 minutes 36 seconds, which seems correct, so I don’t know where 68 years 35 days comes from, why this triggered a reboot event, and why the event was logged at 6:35 am in particular…
(However it did not trigger a reboot alert, as my reboot alerts trigger for an uptime of <15 minutes)
So there is still something wrong with some of the uptime calculations even after yesterday’s fixes. I will keep an eye on the event log to see if I see any more instances of this happening.
I would suggest you post a bit more information about the device in your log so the developers have a bit more info to go on…