Hi have some devices that some of the graphs render fine and others will have large gaps. I have enabled RRDCached as described in this article.
I have searched through the web and have not found any solutions to this and I’m not sure how I can trouble shoot it.
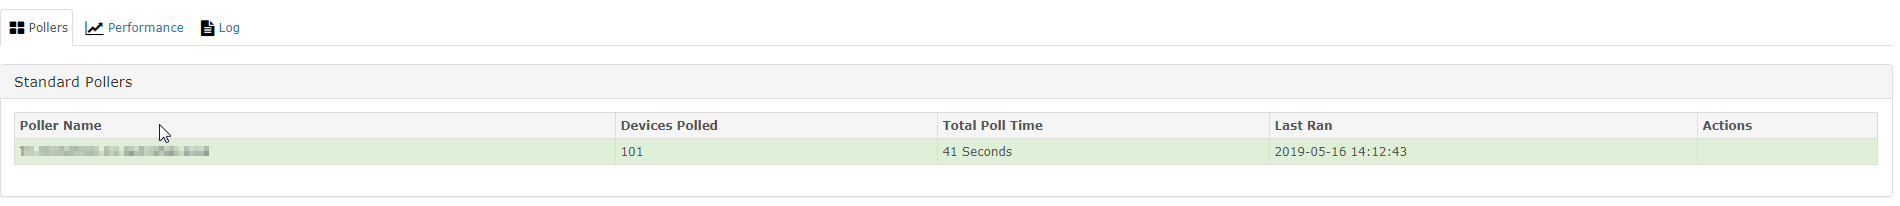
I don’t see any issues with the poller either.
example:
The processor graph looks fine
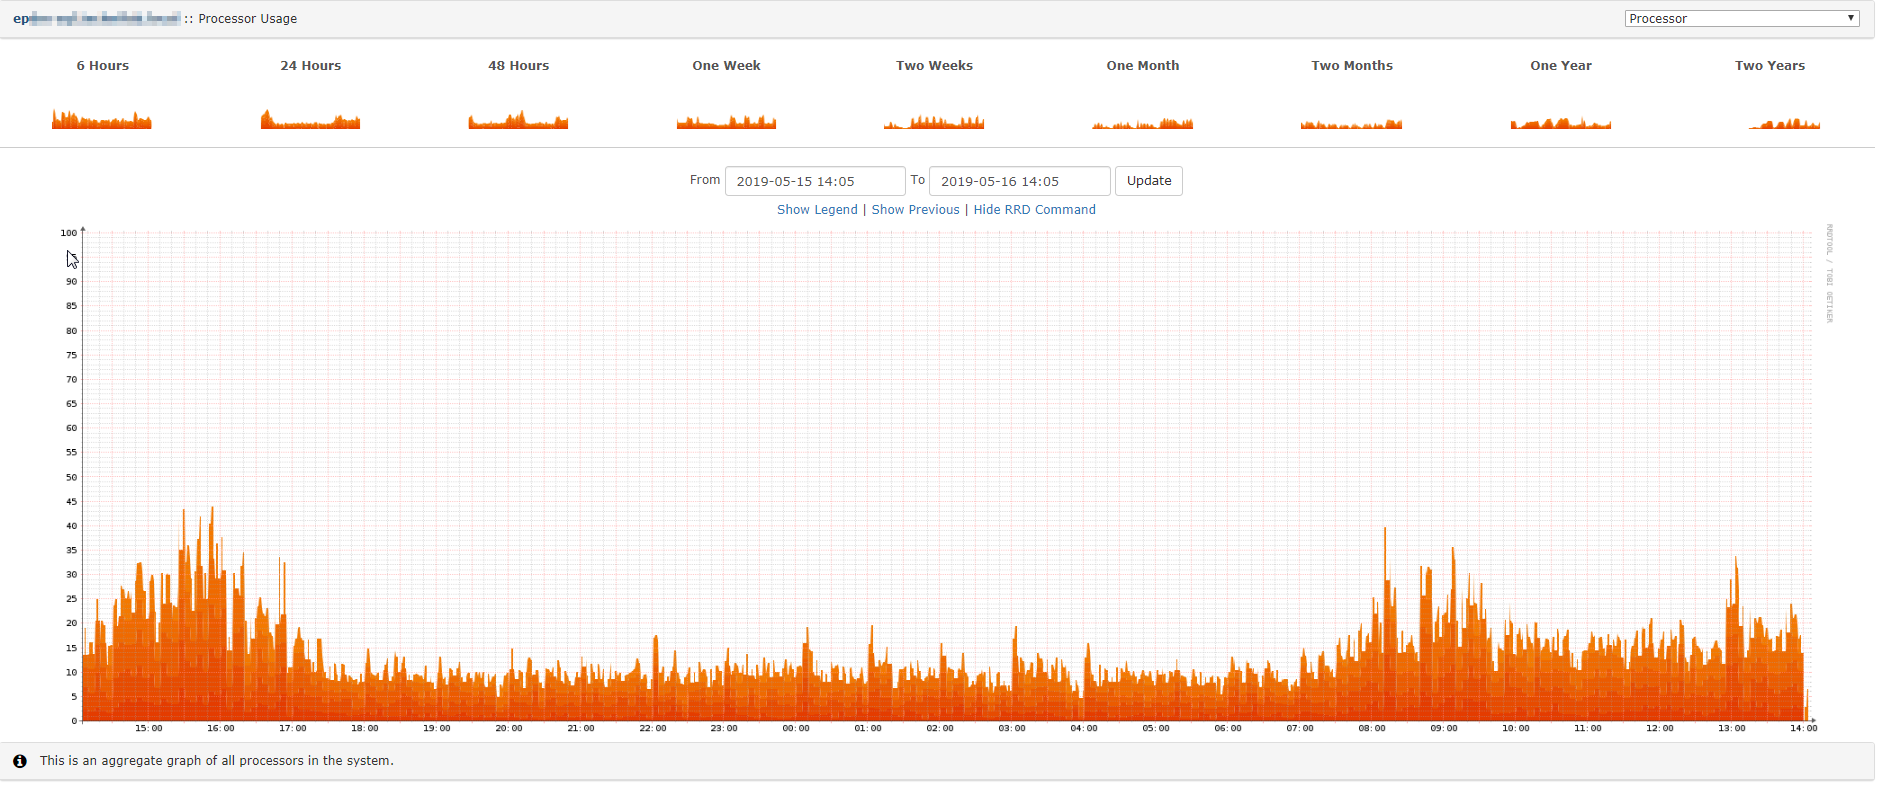
RRDTool Command
rrdtool graph /tmp/3p5dMCotxFvIFt6v  -g -l 0 -u 100 -E --start 1557943500 --end 1558029900 --width 1919.7 --height 543 -c BACK#EEEEEE00 -c SHADEA#EEEEEE00 -c SHADEB#EEEEEE00 -c CANVAS#FFFFFF00 -c GRID#a5a5a5 -c MGRID#FF9999 -c FRAME#5e5e5e -c ARROW#5e5e5e -R normal -c FONT#000000 --font LEGEND:8:DejaVuSansMono --font AXIS:7:DejaVuSansMono --font-render-mode normal COMMENT:'Load %                 Now       Min       Max     Avg\l' DEF:usage0=SERVERNAME/processor-hr-3.rrd:usage:AVERAGE  DEF:usage0min=SERVERNAME/processor-hr-3.rrd:usage:MIN  DEF:usage0max=SERVERNAME/processor-hr-3.rrd:usage:MAX  CDEF:usage_cdef0=usage0,5,/ CDEF:usage_cdef0min=usage0min,5,/ CDEF:usage_cdef0max=usage0max,5,/ AREA:usage_cdef0#E43C00:'Processor        ' GPRINT:usage0:LAST:%5.2lf%s GPRINT:usage0min:MIN:%5.2lf%s GPRINT:usage0max:MAX:%5.2lf%s GPRINT:usage0:AVERAGE:'%5.2lf%s\n' COMMENT:'\n' DEF:usage1=SERVERNAME/processor-hr-4.rrd:usage:AVERAGE  DEF:usage1min=SERVERNAME/processor-hr-4.rrd:usage:MIN  DEF:usage1max=SERVERNAME/processor-hr-4.rrd:usage:MAX  CDEF:usage_cdef1=usage1,5,/ CDEF:usage_cdef1min=usage1min,5,/ CDEF:usage_cdef1max=usage1max,5,/ AREA:usage_cdef1#E74B00:'Processor        ':STACK GPRINT:usage1:LAST:%5.2lf%s GPRINT:usage1min:MIN:%5.2lf%s GPRINT:usage1max:MAX:%5.2lf%s GPRINT:usage1:AVERAGE:'%5.2lf%s\n' COMMENT:'\n' DEF:usage2=SERVERNAME/processor-hr-5.rrd:usage:AVERAGE  DEF:usage2min=SERVERNAME/processor-hr-5.rrd:usage:MIN  DEF:usage2max=SERVERNAME/processor-hr-5.rrd:usage:MAX  CDEF:usage_cdef2=usage2,5,/ CDEF:usage_cdef2min=usage2min,5,/ CDEF:usage_cdef2max=usage2max,5,/ AREA:usage_cdef2#EB5B00:'Processor        ':STACK GPRINT:usage2:LAST:%5.2lf%s GPRINT:usage2min:MIN:%5.2lf%s GPRINT:usage2max:MAX:%5.2lf%s GPRINT:usage2:AVERAGE:'%5.2lf%s\n' COMMENT:'\n' DEF:usage3=SERVERNAME/processor-hr-6.rrd:usage:AVERAGE  DEF:usage3min=SERVERNAME/processor-hr-6.rrd:usage:MIN  DEF:usage3max=SERVERNAME/processor-hr-6.rrd:usage:MAX  CDEF:usage_cdef3=usage3,5,/ CDEF:usage_cdef3min=usage3min,5,/ CDEF:usage_cdef3max=usage3max,5,/ AREA:usage_cdef3#EF6A00:'Processor        ':STACK GPRINT:usage3:LAST:%5.2lf%s GPRINT:usage3min:MIN:%5.2lf%s GPRINT:usage3max:MAX:%5.2lf%s GPRINT:usage3:AVERAGE:'%5.2lf%s\n' COMMENT:'\n' DEF:usage4=SERVERNAME/processor-hr-7.rrd:usage:AVERAGE  DEF:usage4min=SERVERNAME/processor-hr-7.rrd:usage:MIN  DEF:usage4max=SERVERNAME/processor-hr-7.rrd:usage:MAX  CDEF:usage_cdef4=usage4,5,/ CDEF:usage_cdef4min=usage4min,5,/ CDEF:usage_cdef4max=usage4max,5,/ AREA:usage_cdef4#F37900:'Processor        ':STACK GPRINT:usage4:LAST:%5.2lf%s GPRINT:usage4min:MIN:%5.2lf%s GPRINT:usage4max:MAX:%5.2lf%s GPRINT:usage4:AVERAGE:'%5.2lf%s\n' COMMENT:'\n' --daemon unix:/var/run/rrdcached.sock
RRDTool Output

2000x582
OK u:0.24 s:0.03 r:0.28
The RAM Graph not so much
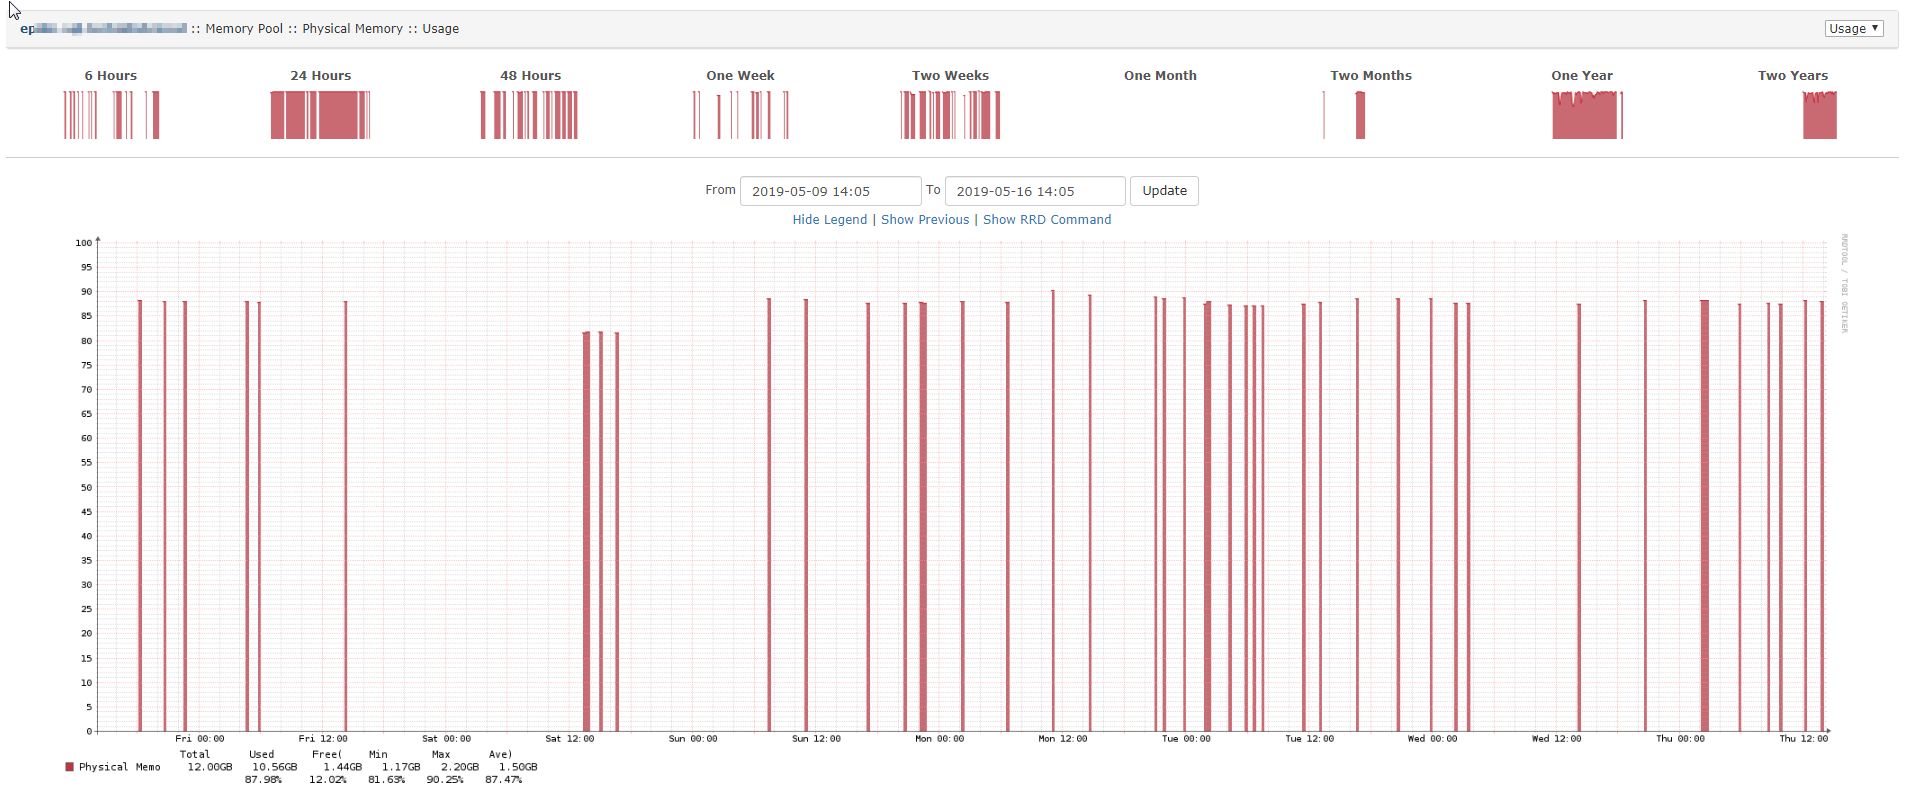
RRDTool Command
rrdtool graph /tmp/I6mMfVqkB7FwFwM2  --alt-autoscale-max --rigid -E --start 1557425100 --end 1558029900 --width 1919.7 --height 543 -c BACK#EEEEEE00 -c SHADEA#EEEEEE00 -c SHADEB#EEEEEE00 -c CANVAS#FFFFFF00 -c GRID#a5a5a5 -c MGRID#FF9999 -c FRAME#5e5e5e -c ARROW#5e5e5e -R normal -c FONT#000000 --font LEGEND:8:DejaVuSansMono --font AXIS:7:DejaVuSansMono --font-render-mode normal -u 100 -l 0 -E -b 1024  COMMENT:'                  Total      Used      Free(    Min       Max      Ave)' COMMENT:'\l' DEF:304used=SERVERNAME/mempool-hrstorage-8.rrd:used:AVERAGE DEF:304free=SERVERNAME/mempool-hrstorage-8.rrd:free:AVERAGE CDEF:304size=304used,304free,+ CDEF:304perc=304used,304size,/,100,* CDEF:304percx=100,304perc,- AREA:304perc#c96a73: LINE1.25:304perc#c4323f:'Physical Memo ' GPRINT:304size:LAST:%6.2lf%sB GPRINT:304used:LAST:%6.2lf%sB GPRINT:304free:LAST:%6.2lf%sB GPRINT:304free:MIN:%5.2lf%sB GPRINT:304free:MAX:%5.2lf%sB GPRINT:304free:AVERAGE:%5.2lf%sB\n COMMENT:'                          ' GPRINT:304perc:LAST:'%5.2lf%%  ' GPRINT:304percx:LAST:'%5.2lf%% ' GPRINT:304perc:MIN:'%5.2lf%% ' GPRINT:304perc:MAX:'%5.2lf%% ' GPRINT:304perc:AVERAGE:%5.2lf%%\n --daemon unix:/var/run/rrdcached.sock
RRDTool Output

2000x626
OK u:0.28 s:0.04 r:0.31
This is happening on Windows Servers and Cisco Networking equipment but not all of each. As you can see in the screen shots there was a time when these were rendering solidly.