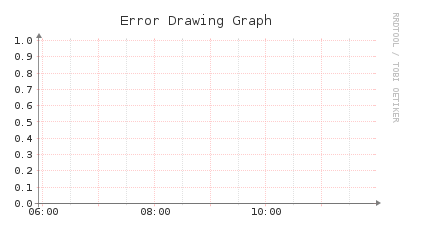
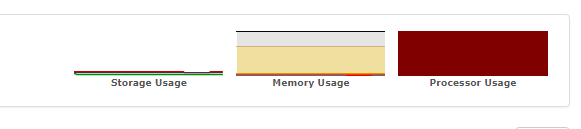
From one day to another 50% of the processor graphs are not drawed. I get the famous “Error Drawing Graph” message, but only on processors. And I monitor powerdns, the graph for one of the powerdns queries is not even made (
I checked validate.php to see what could be wrong, but I always get the same, even though I see in the logs that all devices (17) are polled within 20 seconds)
====================================
| Component | Version |
|---|---|
| LibreNMS | 1.36-24-g3ddeb1d |
| DB Schema | 234 |
| PHP | 7.0.22-0ubuntu0.16.04.1 |
| MySQL | 10.0.33-MariaDB-0ubuntu0.16.04.1 |
| RRDTool | 1.5.5 |
| SNMP | NET-SNMP 5.7.3 |
====================================
[OK] Database connection successful
[OK] Database schema correct
[FAIL] The poller (librenms) has not completed within the last 5 minutes, check the cron job.
root@librenms:/opt/librenms/logs# tail -f librenms.log
/opt/librenms/poller.php 18 2018-02-06 11:55:12 - 1 devices polled in 9.717 secs
/opt/librenms/poller.php 19 2018-02-06 11:55:12 - 1 devices polled in 9.979 secs
/opt/librenms/poller.php 7 2018-02-06 11:55:12 - 1 devices polled in 3.197 secs
/opt/librenms/poller.php 9 2018-02-06 11:55:14 - 1 devices polled in 11.65 secs
/opt/librenms/poller.php 16 2018-02-06 11:55:14 - 1 devices polled in 12.65 secs
/opt/librenms/poller.php 20 2018-02-06 11:55:16 - 1 devices polled in 14.53 secs
/opt/librenms/poller.php 11 2018-02-06 11:55:17 - 1 devices polled in 15.71 secs
/opt/librenms/poller.php 22 2018-02-06 11:55:19 - 1 devices polled in 16.91 secs
/opt/librenms/poller.php 21 2018-02-06 11:55:19 - 1 devices polled in 17.14 secs
/opt/librenms/poller.php 23 2018-02-06 11:55:19 - 1 devices polled in 17.57 secs
This seems to be happening since a newer update. Anything I can check before I pull my hair out? 
MariaDB [librenms]> select * from pollers;
±—±---------------------±--------------------±--------±-----------+
| id | poller_name | last_polled | devices | time_taken |
±—±---------------------±--------------------±--------±-----------+
| 8 | librenms.mydomainhere | 2018-02-06 11:55:19 | 17 | 18 |
±—±---------------------±--------------------±--------±-----------+
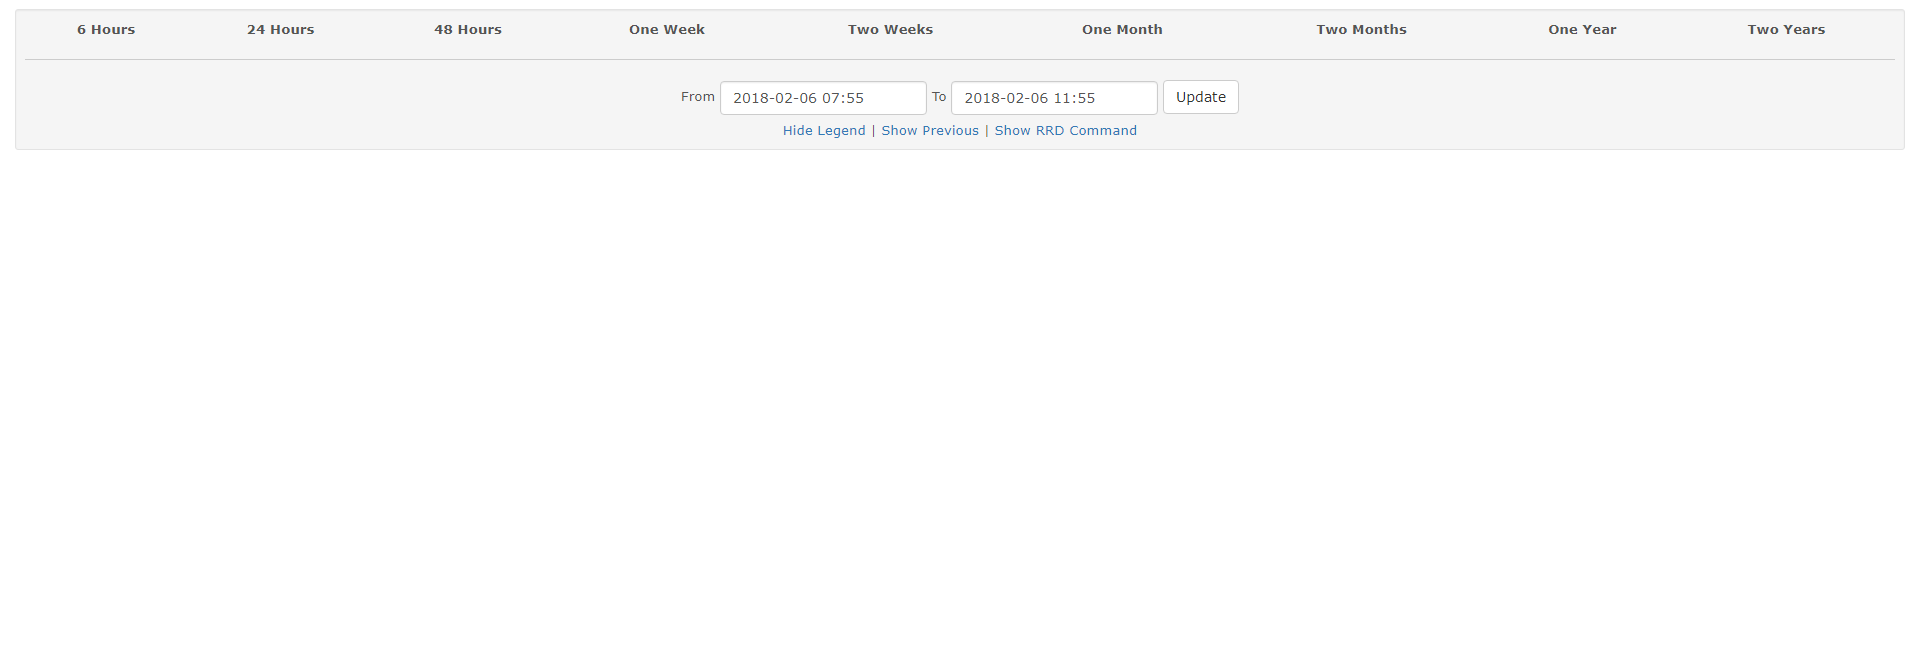
(I wanted to place some screenshots here, but it doesn’t let me, so I’ll followup)
These were all working fine the last time I logged in (two weeks ago). Restarted snmpd on the servers a couple of times, updated the OS, no change. There are also no pollers in the “Unpolled devices” list.
Thanks very much