Hello, my system is a distributed setup with redis & rrdcached, separate web server and db server. I’m having issues with some graphs populating. On the devices without the graphs, I see that there are rrd files collected on the rrd server, but nothing shows on the gui. Some other devices have no problems whatsoever, which makes the troubleshooting process more confusing. I’m able to poll these troublesome devices with another non-distributed setup of librenms though, so I don’t believe it’s a matter of devices not providing valid output to librenms.
I understand there’s not much to go on with, but if anyone can provide some steps I can follow for troubleshooting, it would be greatly appreciated. Here’s my validate outputs:
Web Server:
librenms@lvanms101:~$ ./validate.php
===========================================
Component | Version
--------- | -------
LibreNMS  | 22.10.0-67-g511e34532 (2022-11-02T23:08:52-07:00)
DB Schema | 2022_08_15_084507_add_rrd_type_to_wireless_sensors_table (248)
PHP       | 8.1.11
Python    | 3.8.10
Database  | MariaDB 10.6.10-MariaDB-1:10.6.10+maria~ubu2004-log
RRDTool   | 1.7.2
SNMP      | 5.8
===========================================

[OK]    Composer Version: 2.4.4
[OK]    Dependencies up-to-date.
[OK]    Database connection successful
[OK]    Database Schema is current
[OK]    SQL Server meets minimum requirements
[OK]    lower_case_table_names is enabled
[OK]    MySQL engine is optimal
[OK]
[OK]    Database schema correct
[OK]    MySQl and PHP time match
[OK]    Distributed Polling setting is enabled globally
[OK]    Connected to rrdcached
[OK]    Active pollers found
[FAIL]  Some dispatcher nodes have not checked in recently
        Inactive Nodes:
         lvanms104-p2
         lvanms104-p3
         lvanms104-p1
         lvanms104-p4
[OK]    Locks are functional
[OK]    Python wrapper cron entry is not present
[OK]    Redis is functional
[WARN]  IPv6 is disabled on your server, you will not be able to add IPv6 devices.
[OK]    rrdtool version ok
[OK]    Connected to rrdcached
validate.php from first poller which most devices are assigned to:
===========================================
Component | Version
--------- | -------
LibreNMS  | 22.10.0-67-g511e34532 (2022-11-02T23:08:52-07:00)
DB Schema | 2022_08_15_084507_add_rrd_type_to_wireless_sensors_table (248)
PHP       | 8.1.11
Python    | 3.8.10
Database  | MariaDB 10.6.10-MariaDB-1:10.6.10+maria~ubu2004-log
RRDTool   | 1.7.2
SNMP      | 5.8
===========================================

[OK]    Composer Version: 2.4.4
[OK]    Dependencies up-to-date.
[OK]    Database connection successful
[OK]    Database Schema is current
[OK]    SQL Server meets minimum requirements
[OK]    lower_case_table_names is enabled
[OK]    MySQL engine is optimal
[OK]
[OK]    Database schema correct
[OK]    MySQl and PHP time match
[OK]    Distributed Polling setting is enabled globally
[OK]    Connected to rrdcached
[OK]    Active pollers found
[FAIL]  Some dispatcher nodes have not checked in recently
        Inactive Nodes:
         lvanms104-p2
         lvanms104-p3
         lvanms104-p1
         lvanms104-p4
[OK]    Locks are functional
[OK]    Python wrapper cron entry is not present
[OK]    Redis is functional
[WARN]  IPv6 is disabled on your server, you will not be able to add IPv6 devices.
[OK]    rrdtool version ok
[OK]    Connected to rrdcached
Not really sure where that comes from, I’ll keep troubleshooting and posting relevant information, in the meantime I appreciate recommendations for what to check. Thank you.
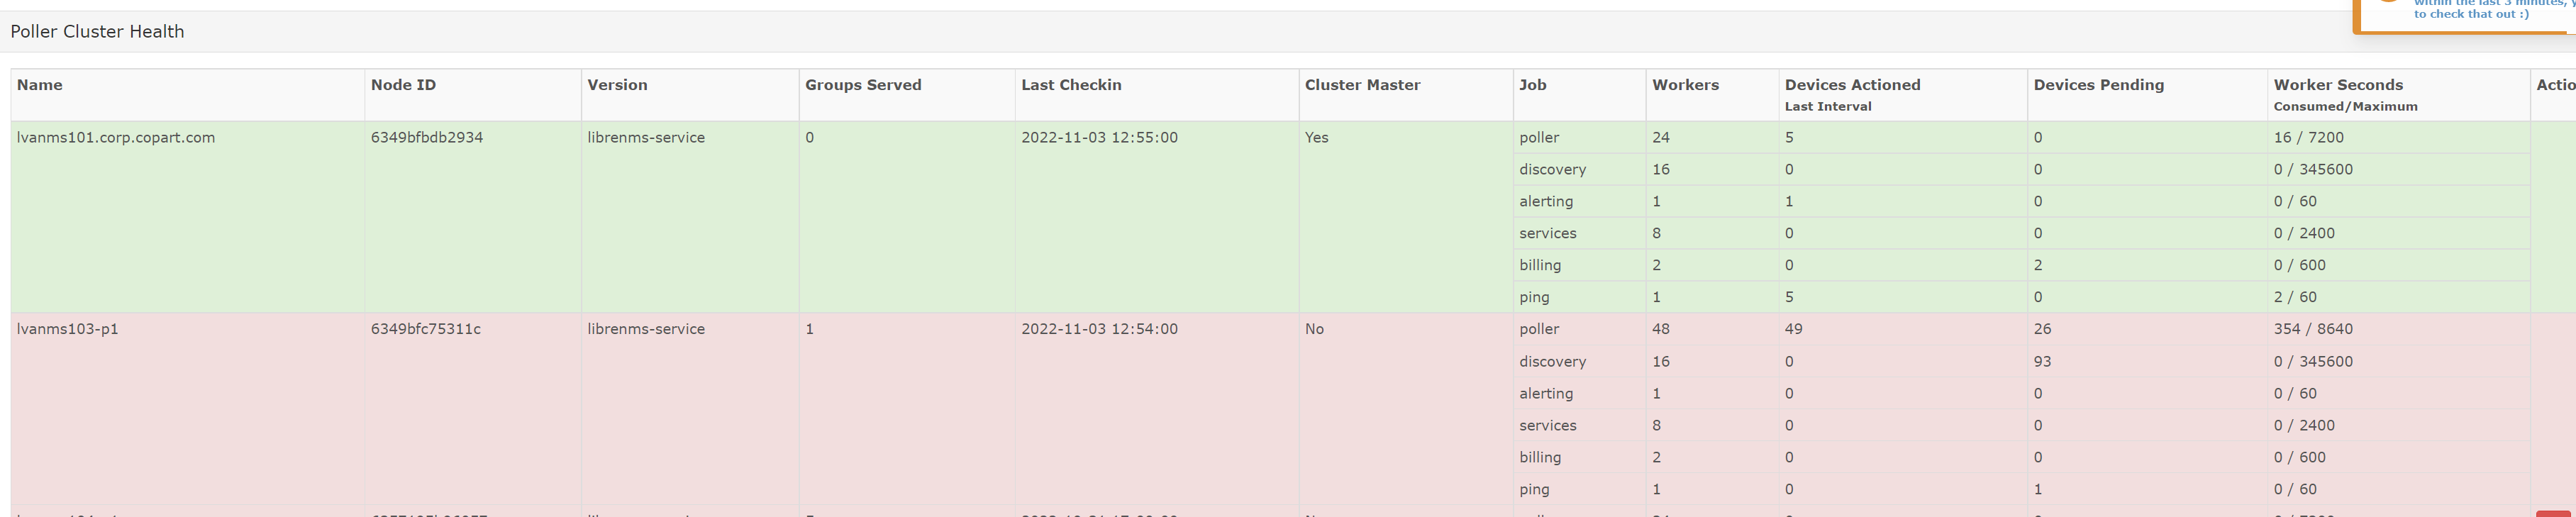
On further checking, I see this seems to be mainly due to poller not being able to complete polling in time. Another Librenms box on a single non distributed server is able to poll more devices in same time period somehow so there seems to be an inefficiency somewhere with this distributed server setup. I will create a new topic if I can collect more details, but if anyone has any insights to this type of setup, I appreciate any assistance.
Remember in any install distributed or not, you only want ONE instance of the following services in the whole cluster:
rrdcached
mysql
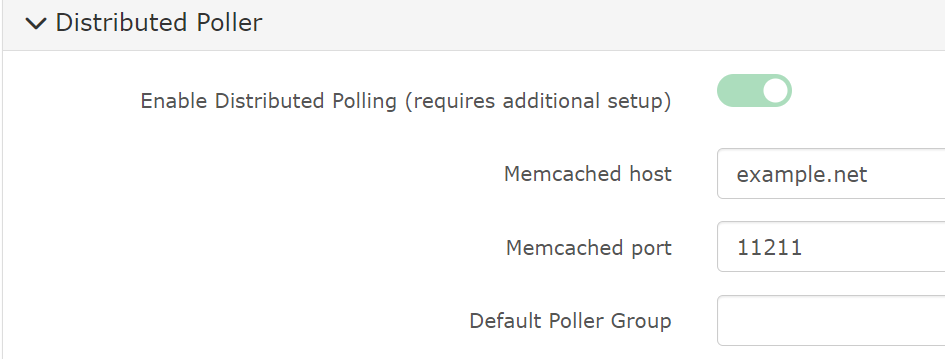
redis (memcached if using cron)
If you have more than one of those, you have broken things.
Please check you only have one instance of these and that all nodes can make connections to the respective services.
Thanks for your response @murrant . All pollers seem to show up on that message time to time. I thought the wording was same regardless of types of nodes. Pollers are being referred here, and they were reported as not checking in and I assumed that was because I haven’t assigned any devices to poll to these pollers. But dispatching is job of redis in my case and I do have only one of that.
My Env file has this setting on all my nodes for redis, and config.php has the next section for rrdcached on all my nodes, including the ones listed on that message:
I do not use memcached, so I left this field alone. Would this be causing issues?
I appreciate if you can provide information any possible settings to check.
Check the poller debug output on all nodes to confirm it is sending data to the rrdcached server.
Make sure rrdcached has flushed to the disk, because using rrdtool without the --daemon switch can exclude cached data.