Hi, I have a Sophos XGS 5500 with 20.0.3 MR-3-Build427 version.
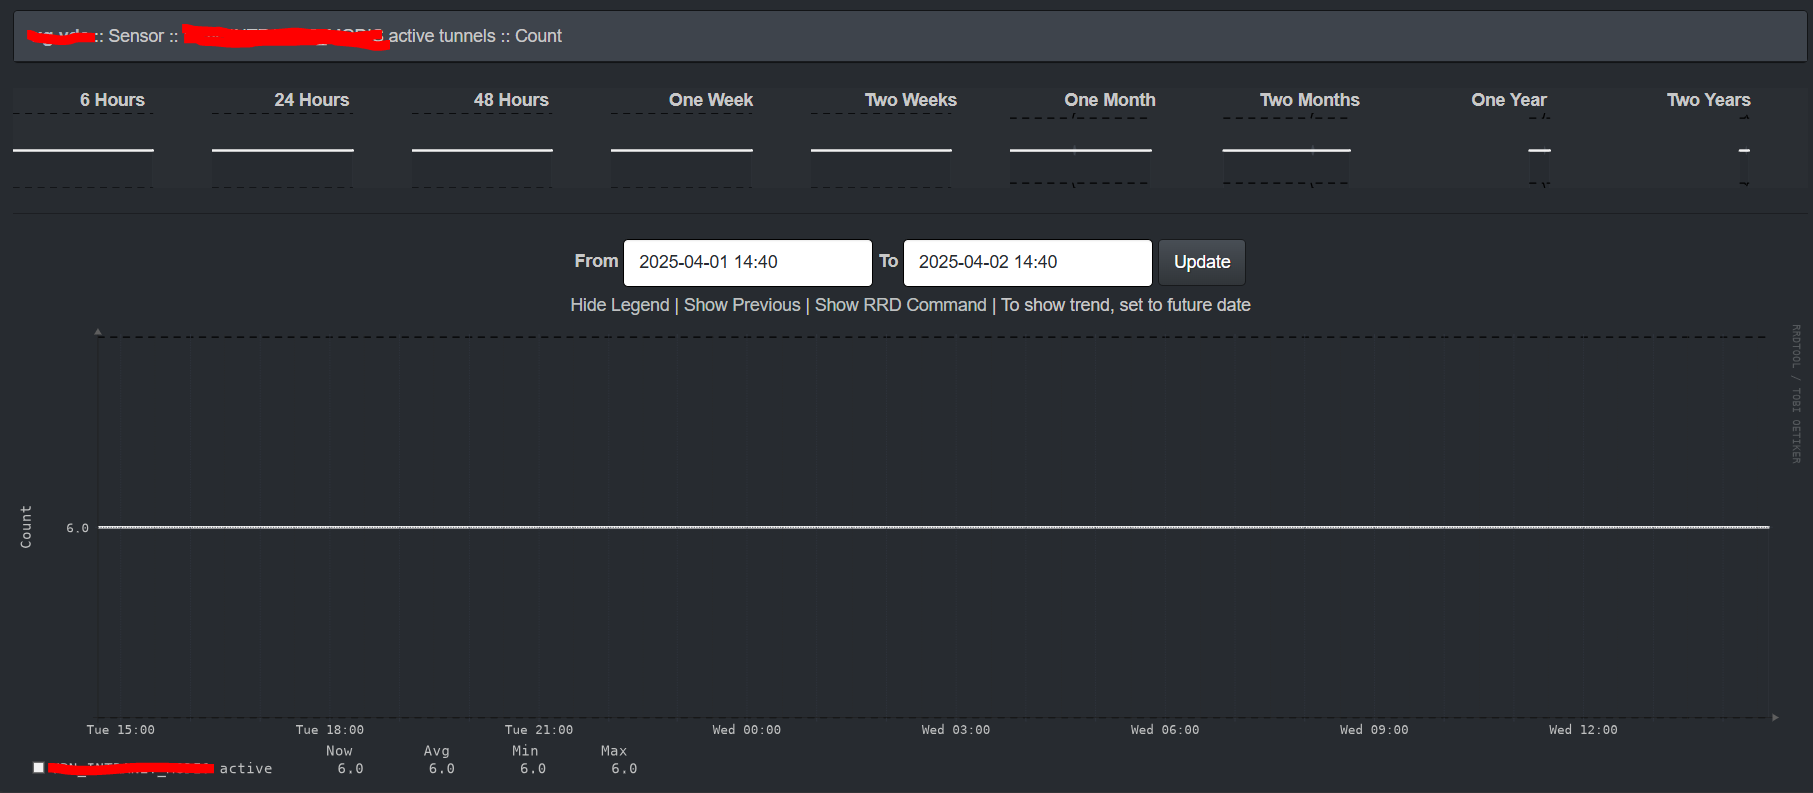
I’m actually struggling to understand what this sensor poll and what is the meaning of the different levels?
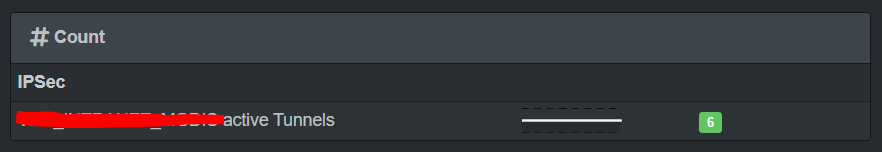
A few days ago we lost some VPN IPSec connections.
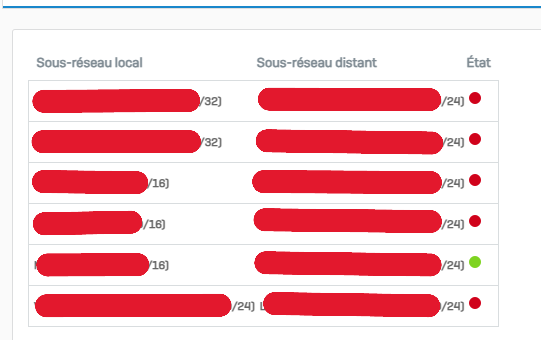
But the graph and the state of this sensor has never changed.
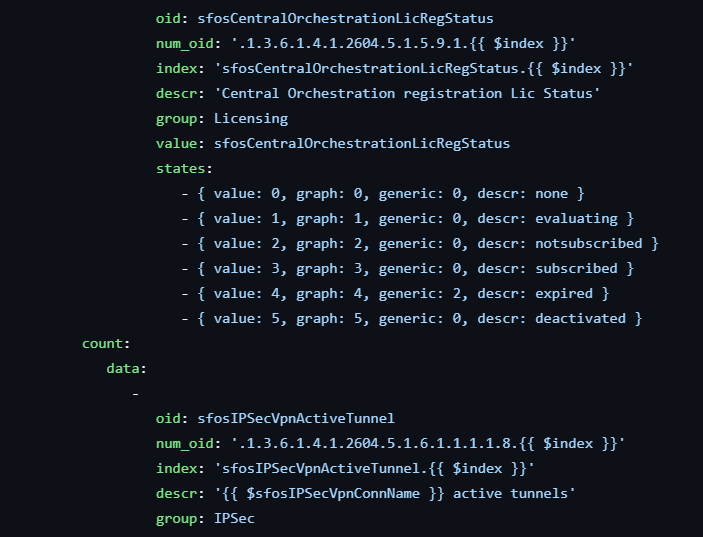
Also, I search in the .yaml files of Sophos in librenms but doesn’t find a clear description of the different states of this sensor.
So can anyone help me with this?
- ./validate.php
===========================================
Component | Version
--------- | -------
LibreNMS  | 25.3.0-85-g4fd92b21d (2025-04-02T20:30:21+02:00)
DB Schema | 2025_03_19_205700_fix_ospfv3_ports_table (331)
PHP       | 8.3.14
Python    | 3.9.2
Database  | MariaDB 10.5.26-MariaDB-0+deb11u2
RRDTool   | 1.7.2
SNMP      | 5.9
===========================================

[OK]    Composer Version: 2.8.6
[OK]    Dependencies up-to-date.
[OK]    Database connection successful
[OK]    Database connection successful
[OK]    Database Schema is current
[OK]    SQL Server meets minimum requirements
[OK]    lower_case_table_names is enabled
[OK]    MySQL engine is optimal
[OK]    Database and column collations are correct
[OK]    Database schema correct
[OK]    MySQL and PHP time match
[OK]    Active pollers found
[OK]    Dispatcher Service not detected
[OK]    Locks are functional
[OK]    Python poller wrapper is polling
[OK]    Redis is unavailable
[OK]    rrd_dir is writable
[OK]    rrdtool version ok