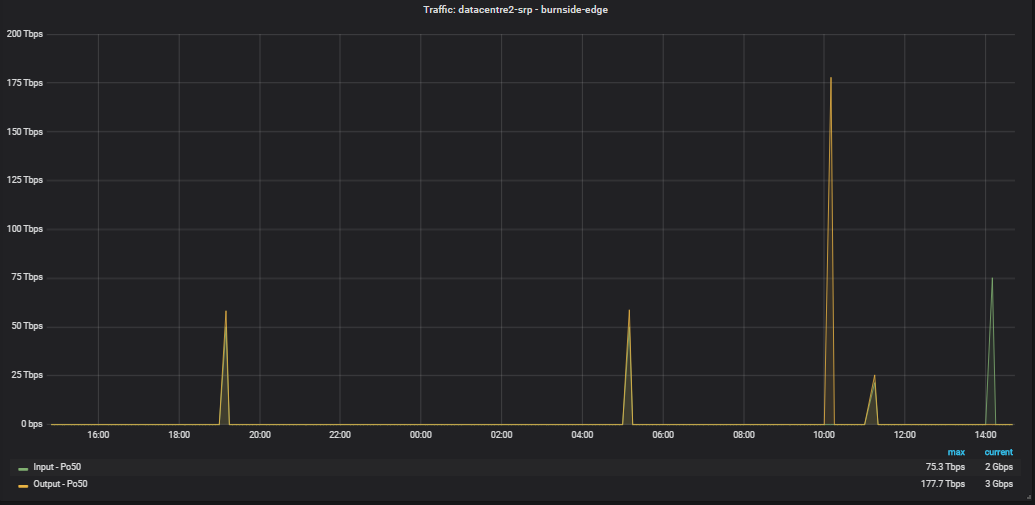
Quite often our routers get busy and drop SNMP polling requests so we get gaps in our RRD files. However, I am also exporting our LibreNMS metrics into InfluxDB so we can create dashboards with Grafana. I’ve noticed that when there are gaps in the LibreNMS RRD graphs we get huge spikes in the Grafana graphs. This makes sense as it is a calculation of last data to new data. Anyone know a way around this? I’ve seen people in Grafana set upper limits in the query to the InfluxDB.
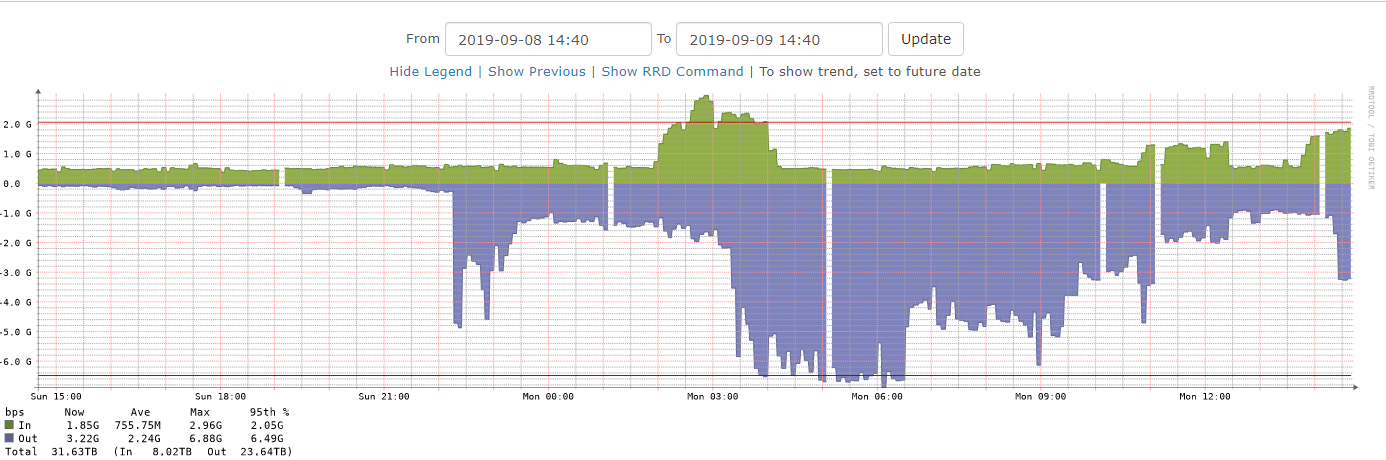
Here are two graphs, one from LibreNMS and the other from Grafana of the same port on the same router and you’ll see when there are gaps in LibreNMS there are spikes in Grafana.