Hi all.
Output from validate.php to get that out of the way:
| Component | Version |
|---|---|
| LibreNMS | 21.9.0-8-g0d499b538 |
| DB Schema | 2021_08_26_093522_config_value_to_medium_text (217) |
| PHP | 7.4.3 |
| Python | 3.8.10 |
| MySQL | 10.3.31-MariaDB-0ubuntu0.20.04.1 |
| RRDTool | 1.7.2 |
| SNMP | NET-SNMP 5.8 |
| ==================================== |
[OK] Composer Version: 2.1.8
[OK] Dependencies up-to-date.
[OK] Database connection successful
[OK] Database schema correct
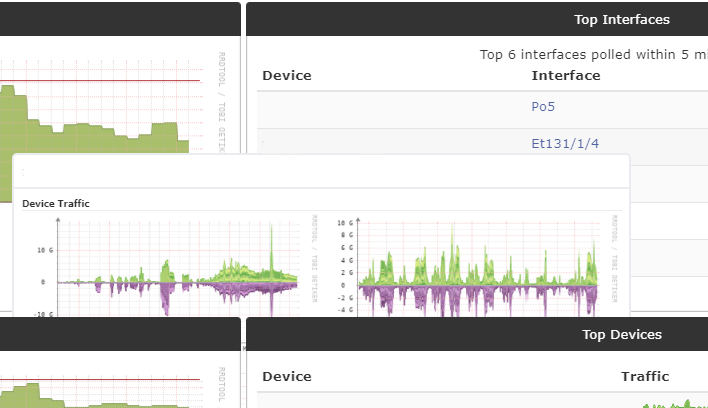
Since the past couple of weeks (not sure exactly when this behavior began) I’ve noticed some strange and inconsistent behavior with mouse-over graphs.
When hovering over graphs in the “Top Interfaces” widget the graphs disappear behind other widgets below it and doesn’t seem to be anchored to the mouse pointer(cursor?) ie. its position never changes even if I drag the pointer across the hostname/interfacename/Total Traffic graph.
The only other place I’m seeing this kind of behavior is if I click on a device and hover over the devicename on the device page.
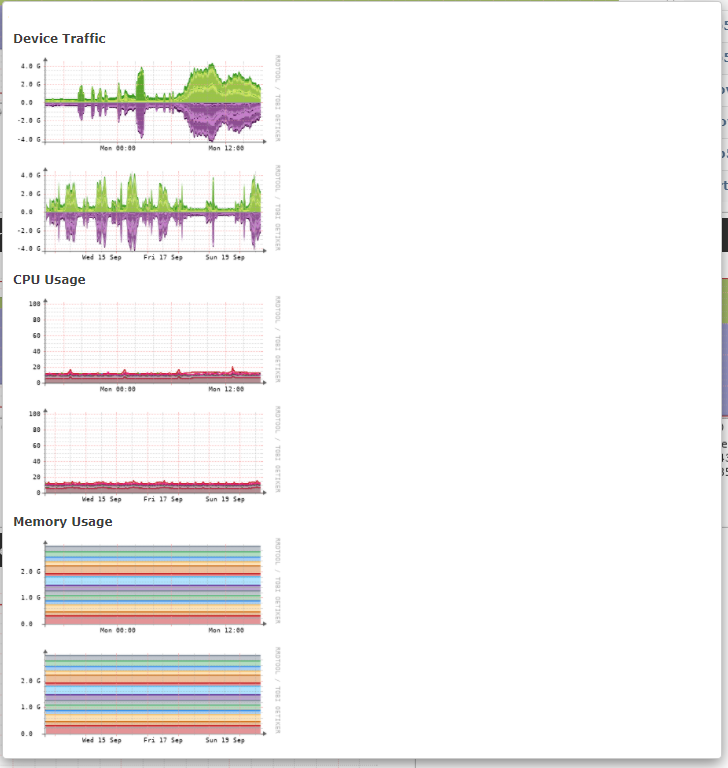
All other graphs appear above other widgets, and seem properly anchored to the mouse pointer, but there all the graphs are stacked on top of each other instead of having the two related graphs side-by-side leaving half of the mouse-over “window” empty.
I used the Top Devices widget for this example but all mouse-over graphs look like this except for the above mentioned examples as far as I can tell.
No changes to the configuration of graphs have been made recently except turning off “Zoom port graphs to port speed” that got enabled in one of the fairly recent updates, I tried changing that setting back but no, immediate at least, effect could be seen.
Global graph settings look like this
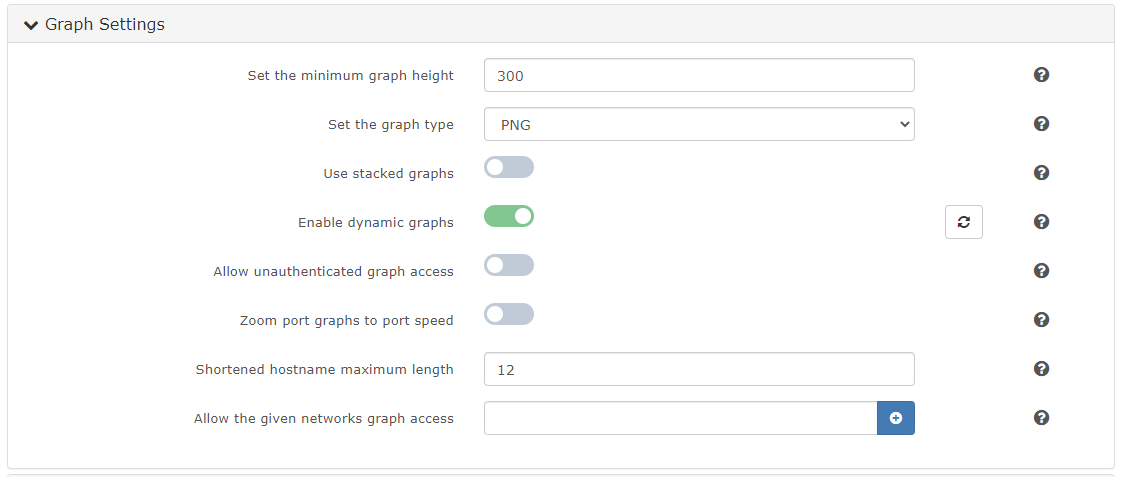
We have tried several different computers (W10 on all) and different browsers, Firefox v. 92.0, Chrome v. 93.0.4577.82, Vivaldi v. 4.2.2406.44, and they all display the graphs this way.
This is clearly not a huge issue, more of an annoyance, but any help/tips would be appreciated. ![]()
Regards,
Roger
