Would like to know how you are calculating the value for System and Swap IO graphs ?. When I checked the rrd data , its stores the value as counter.
If I tried to calculate it with 1s time period, Output doesn’t come up with the value that shows on LIbrenms graph.
Here is my Query [ Influxdb]:
IOSent: SELECT derivative(mean(“value”), 1s) FROM “ucd_cpu” WHERE “hostname” = ‘dev.tech.local’ AND “oid” = ‘ssIORawSent’ AND $timeFilter GROUP BY time($interval) fill(null)
IOReceived: SELECT derivative(mean(“value”), 1s) FROM “ucd_cpu” WHERE “hostname” = ‘dev.tech.local’ AND “oid” = ‘ssIORawReceived’ AND $timeFilter GROUP BY time($interval) fill(null)
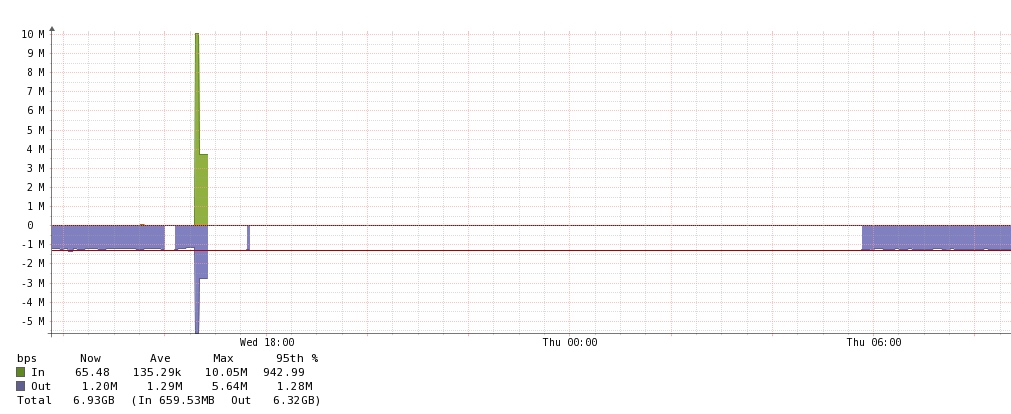
LIbreNMS graph data:
Grafana Data:

Please help. Thanks in Advance