The graphics cannot be displayed properly. The graphics are as follows.

You really haven’t said why you think this is an issue. If you’re device isn’t doing that traffic level then FAQ - LibreNMS Docs
Hi Laf,
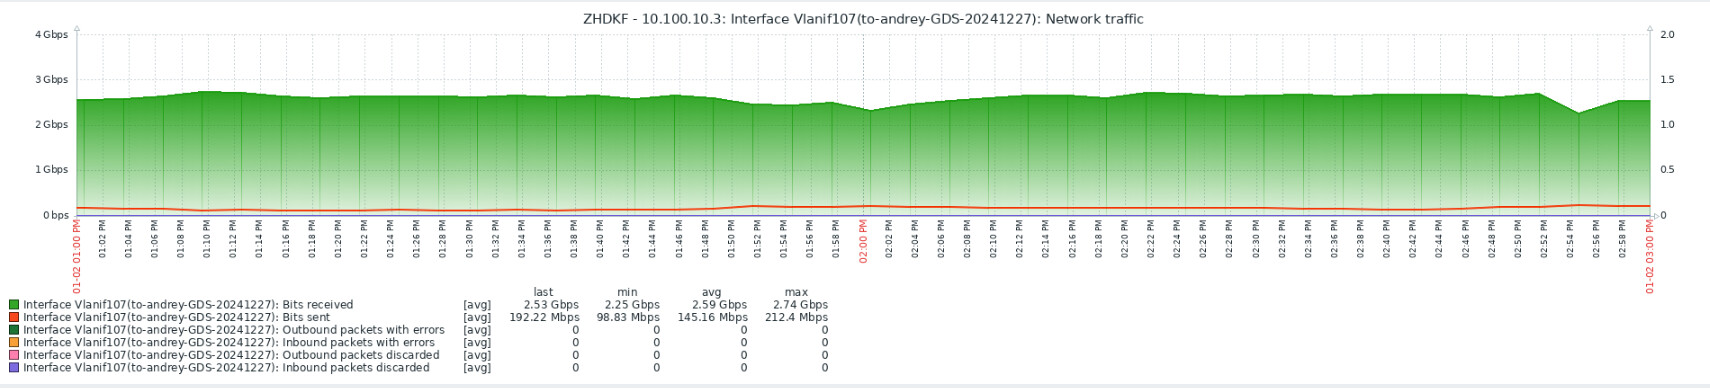
It appears that there are two 1-minute polling graphs, with Zabbix looking more normal, while LibreNMS seems to have values from the first minute shifted to the following minute. Both the 5-minute polling graph and the 1-minute polling graph in LibreNMS exhibit this issue. The monitoring server and the monitored switch are connected to the same switch. What could be causing this problem?

I have an almost similar problem with the graph of one interface appearing inverted.
