Good Morning.
Since a few days, I see that the ping graphs do not appear.
If I load the page in debug mode the following error appears
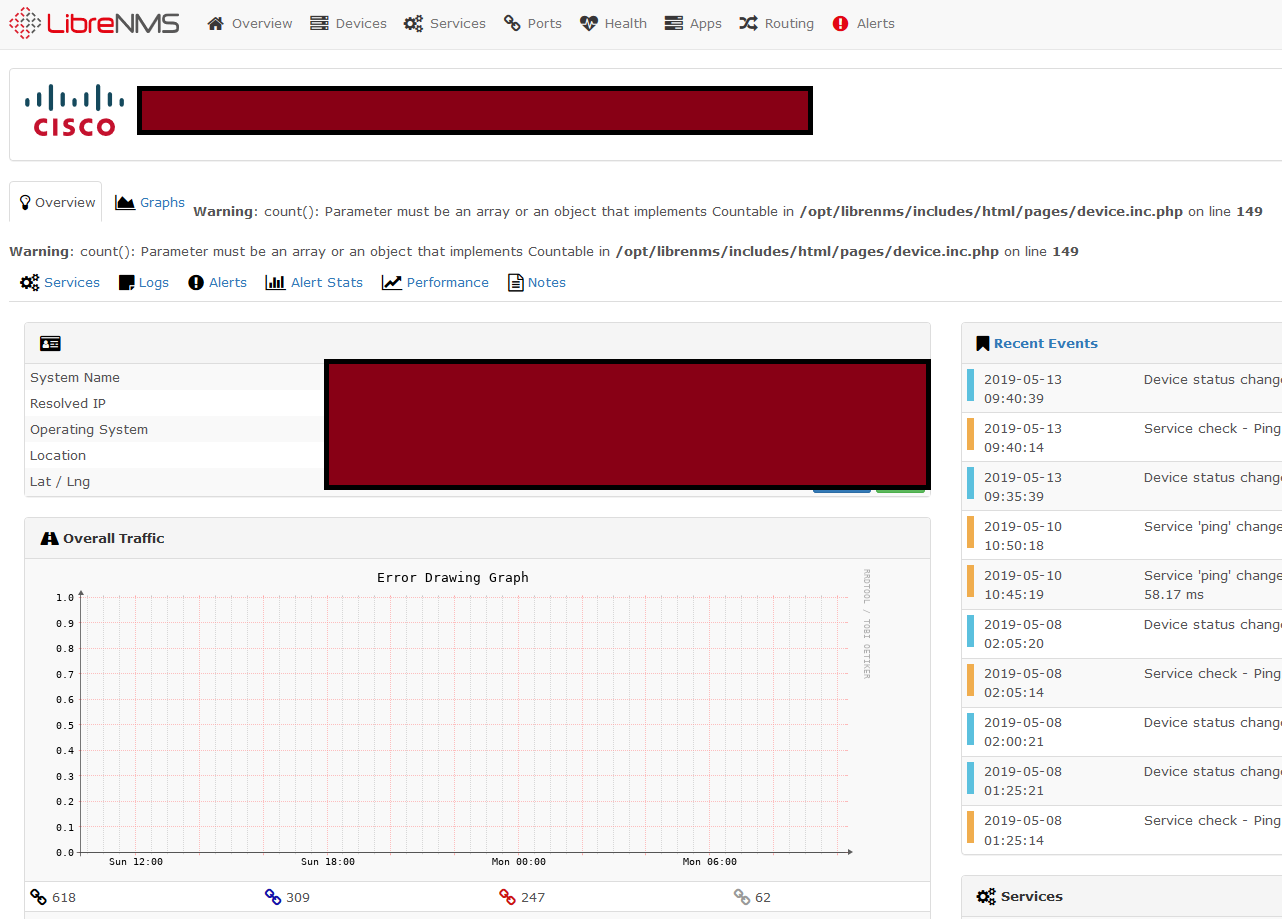
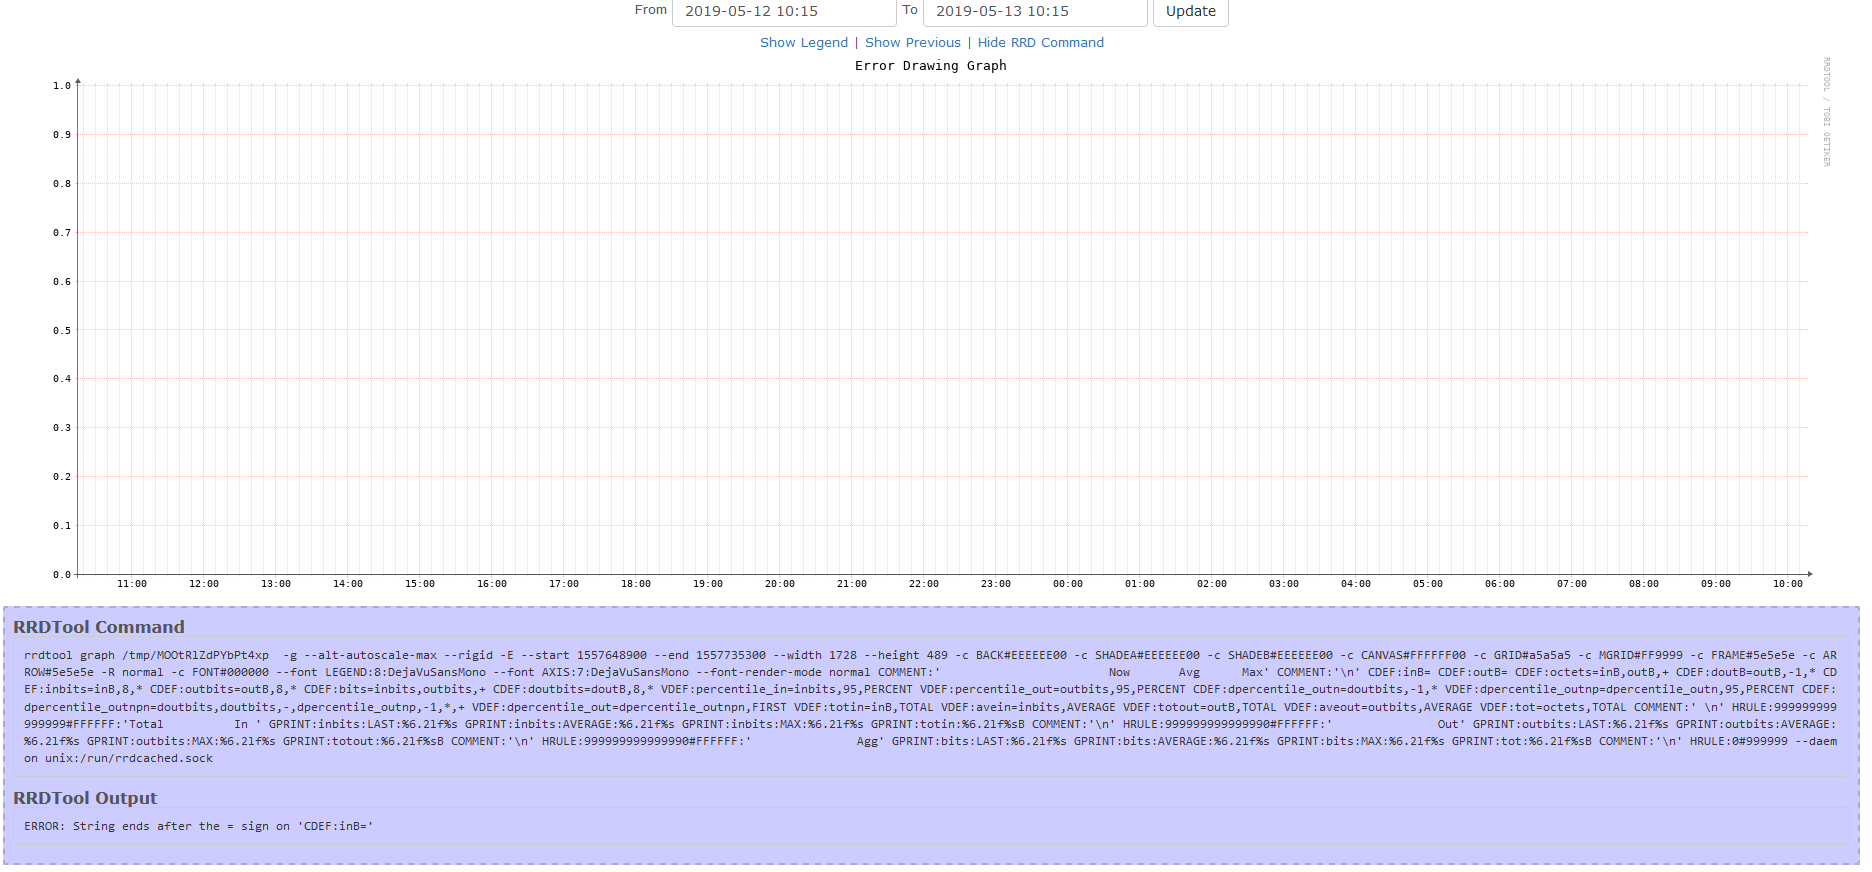
The rrdtool command creates the following error:
ERROR: String ends after the = sign on ‘CDEF: inB =’
Can somebody help me?
Thank you.
[root@librenms librenms]# ./validate.php
====================================
Component | Version
--------- | -------
LibreNMS  | 1.51-38-g2187967
DB Schema | 2019_02_10_220000_add_dates_to_fdb (132)
PHP       | 7.2.16
MySQL     | 5.5.60-MariaDB
RRDTool   | 1.4.8
SNMP      | NET-SNMP 5.7.2
====================================

[OK]    Composer Version: 1.8.5
[OK]    Dependencies up-to-date.
[OK]    Database connection successful
[OK]    Database schema correct

LibreNMS Discovery
===================================
Version info:
Commit SHA: 2187967854931f496e2ab4451ad51c03f1a4a04d
Commit Date: 1557722654
DB Schema: 2019_02_10_220000_add_dates_to_fdb (132)
PHP: 7.2.16
MySQL: 5.5.60-MariaDB
RRDTool: 1.4.8
SNMP: NET-SNMP 5.7.2
==================================DEBUG!
MySQL [1/0.00s]: Cell[1/0.00s] Row[-1/-0.00s] Rows[1/0.00s] Column[0/0.00s] Update[0/0.00s] Insert[0/0.00s] Delete[0/0.00s]
LibreNMS Poller
Version info:
Commit SHA: 2187967854931f496e2ab4451ad51c03f1a4a04d
Commit Date: 1557722654
DB Schema: 2019_02_10_220000_add_dates_to_fdb (132)
PHP: 7.2.16
MySQL: 5.5.60-MariaDB
RRDTool: 1.4.8
SNMP: NET-SNMP 5.7.2
==================================DEBUG!
Starting polling run:
Hostname: aranda-router
Device ID: 36
OS: ciscosb
Resolved IP: 192.168.20.9
RRD[[0;32mupdate aranda-router/ping-perf.rrd N:53.2 --daemon unix:/run/rrdcached.sock[0m]
[[0;31mRRD Disabled[0m]RRD[[0;32mupdate aranda-router/poller-perf.rrd N:1.099 --daemon unix:/run/rrdcached.sock[0m]
[[0;31mRRD Disabled[0m]
Polled in 1.099 seconds
#### Start Alerts ####
Rule [0;35m#1 (Devices up/down):[0m Status: [0;34mNOCHG[0m
Rule [0;35m#2 (Device rebooted):[0m Status: [0;34mNOCHG[0m
Rule [0;35m#5 (Port status up/down):[0m Status: [0;34mNOCHG[0m
Rule [0;35m#6 (Port utilisation over threshold):[0m Status: [0;34mNOCHG[0m
Rule [0;35m#7 (Sensor over limit - Check Device Health Settings):[0m Status: [0;34mNOCHG[0m
Rule [0;35m#8 (Sensor under limit - Check Device Health Settings):[0m Status: [0;34mNOCHG[0m
Rule [0;35m#9 (Service up/down):[0m Status: [0;34mNOCHG[0m
Rule [0;35m#10 (Wireless Sensor over limit):[0m Status: [0;34mNOCHG[0m
Rule [0;35m#11 (Wireless Sensor under limit):[0m Status: [0;34mNOCHG[0m
Rule [0;35m#12 (State Sensor Critical):[0m Status: [0;34mNOCHG[0m
#### End Alerts ####
MySQL [17/0.03s]: Cell[28/0.03s] Row[-28/-0.03s] Rows[13/0.02s] Column[1/0.00s] Update[1/0.00s] Insert[2/0.00s] Delete[0/0.00s]