Title: Ports > Oper Status = Down filter showing ports that are actually UP after upgrade to 26.5.1 / 26.6.1-dev

Issue Description:

After upgrading LibreNMS to 26.5.1 (currently showing 26.6.1-dev.36+b0283d139), the Ports page appears to show incorrect results when filtering by:

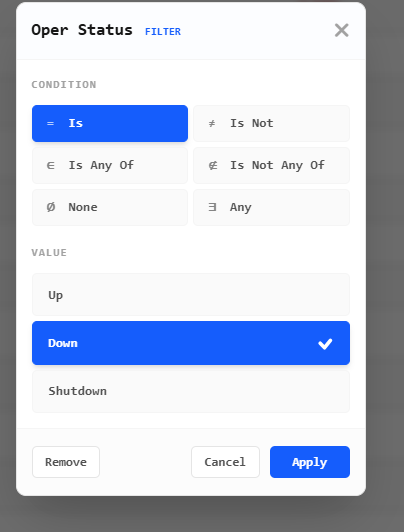
Ports → Oper Status → Down

The filter returns ports that appear to be operationally UP on the device. In the Down Ports view, some ports show a green status indicator even though they are listed in the Down filter.

Their was a small update to the port filter after the version you are on (you’re not on the stable monthly release if you’re seeing -dev in the version number) so make sure you update again and re-test.

Thanks for the suggestion.

I updated and verified that my installation is fully up to date.

Output:

git rev-list HEAD..origin/master --count
0

The issue still persists after updating.

Steps:

  1. Ports

  2. Filter: Oper Status = Down

  3. Apply

Result:
Ports are listed under the Down filter, but some entries show a green status indicator in the UI.

Validation is otherwise clean and the database contains ports with ifOperStatus=‘down’.

Can you advise what additional debug information would help determine whether this is a UI rendering issue or a port status synchronization issue?

You’ll need to run a mysql query to see what the ifOperStatus and ifAdminStatus is.

The port filter for Oper Status = down runs:

ifOperStatus != ‘up AND ifAdminStatus != ‘down’

So:

select ifOperStatus, ifAdminStatus from ports where port_id=X;

X = the port Id which you can get it if click the port in the results and look in the url.

Also, show a screenshot of the list of ports with the filter applied.

I did a spot check and found a port that had ifOperStatus=lowerLayerDown, which seems to be marked as green on the left even though the port text is red.

So looks like the filter is right and the indicator is wrong based on my analysis.

I updated and verified the installation.

Current version:
LibreNMS 26.6.0

Verification:

git log -1 --oneline
a2a0405f2 (HEAD, tag: 26.6.0) Bump version to 26.6.0

php artisan about
Version: 26.6.0

The issue still exists after updating.

When filtering:
Ports → Oper Status = Down

Some ports appear with a green status indicator in the UI while still being listed in the Down filter.

I have also verified that the database contains ports with ifOperStatus=‘down’.

Can you advise what additional debugging information would be useful (API output, browser console, specific port examples, etc.)?

All those ports are down!

Please tell me your not looking at that green circle?

Thanks, I understand that these ports are operationally down.

My question is slightly different.

These ports have both of the following options enabled:

  • Disable Polling

  • Ignore Alerts

Since these ports are intentionally disabled from monitoring and alerting, I expected them not to appear in the Ports → Oper Status = Down view.

However, they are still listed in the Down ports filter.

Is this expected behavior?

Does “Disable Polling” and “Ignore Alerts” only suppress polling/alerts, while the ports are still included in status-based port searches and filters?

Or should these ports be excluded from the Down ports view?

Correct, I was referring to the green circle shown in the port list.

However, my main concern is slightly different.

I understand these ports are operationally down.

The issue is that these ports have both:

  • Disable Polling enabled

  • Ignore Alerts enabled

Since they are intentionally excluded from monitoring and alerting, I expected them not to appear in the Ports → Oper Status = Down view.

Is it expected behavior that ports with “Disable Polling” and “Ignore Alerts” enabled are still included in the Down Ports filter?

If so, then my understanding of the feature was incorrect.

That’s just personal preference and aren’t ‘Operational down’ ports. You’ll just need to update the filter. You can save filter preferences so that when you go back to the ports list those ones are not shown but it won’t work when clicking a link to a pre-set list of filtered ports.
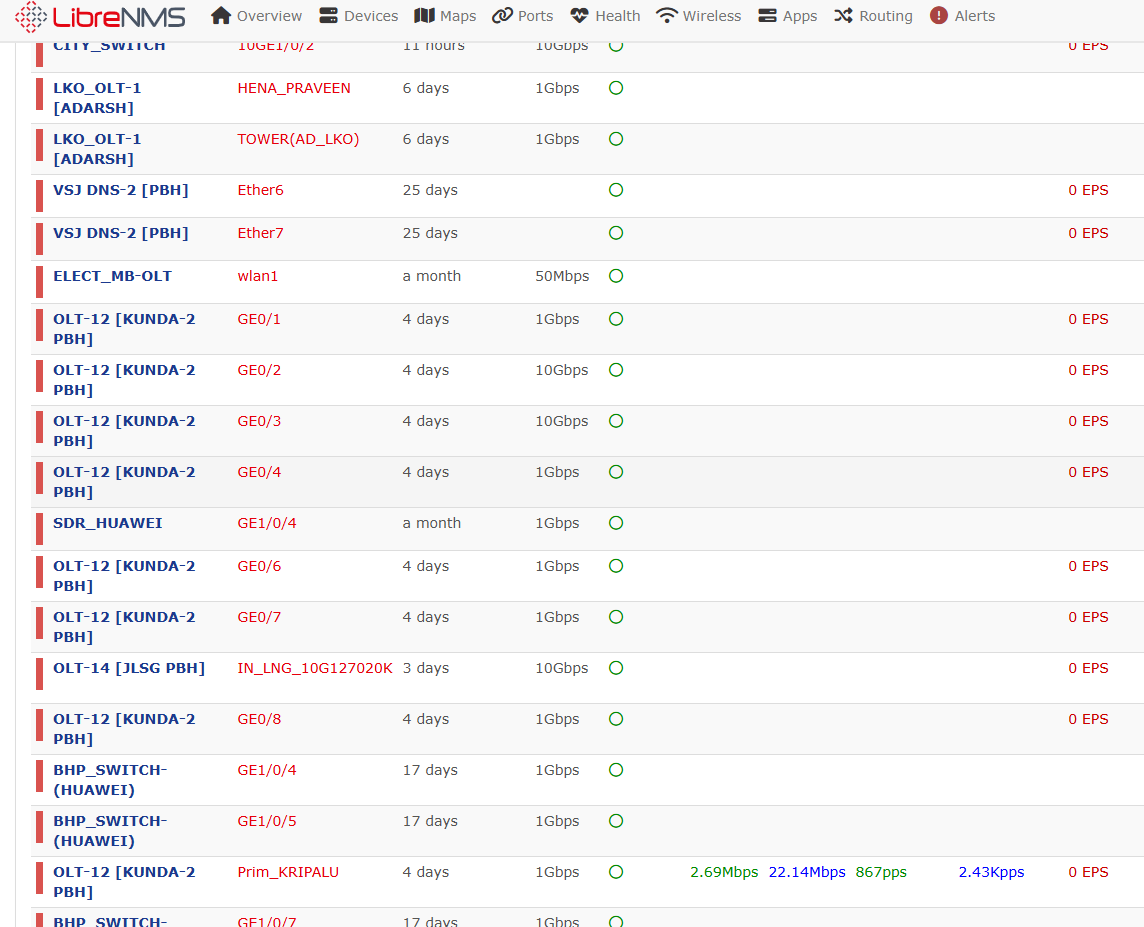
That is not the port status, look at the column header at the top, it’s the Duplex status