but other display normal
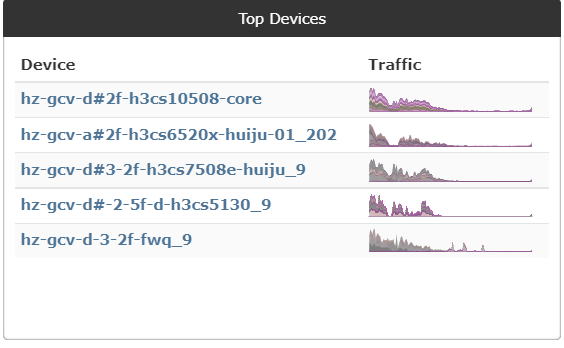
but other display normal
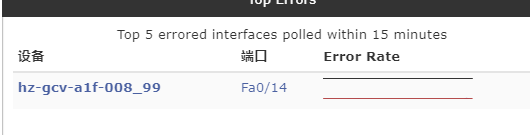
Are you sure those ports are showing errors?
I’m sure so
And it happened that there was a problem with the regional network
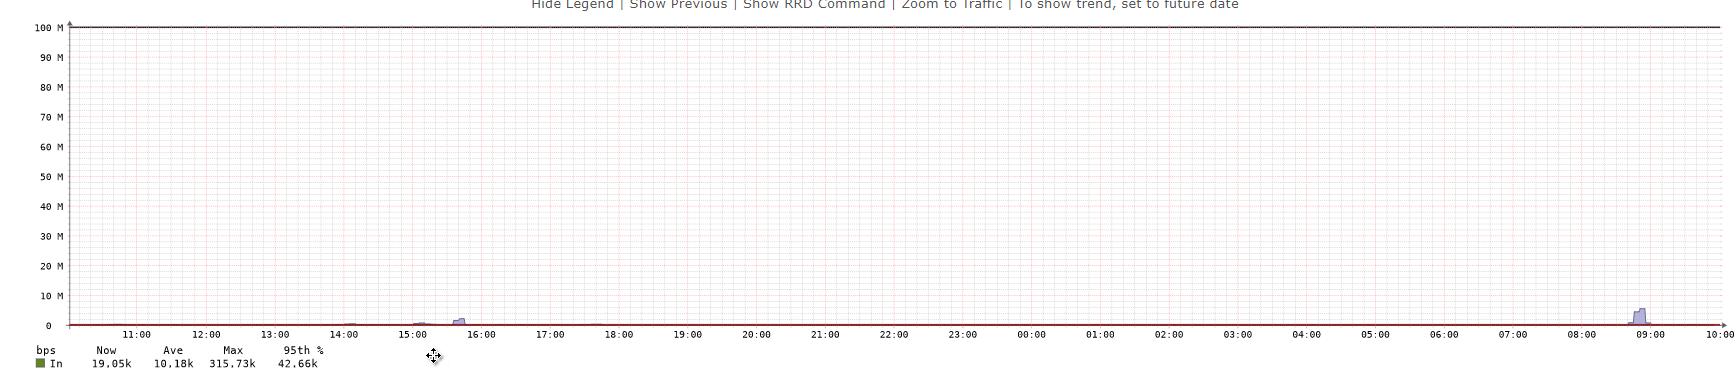
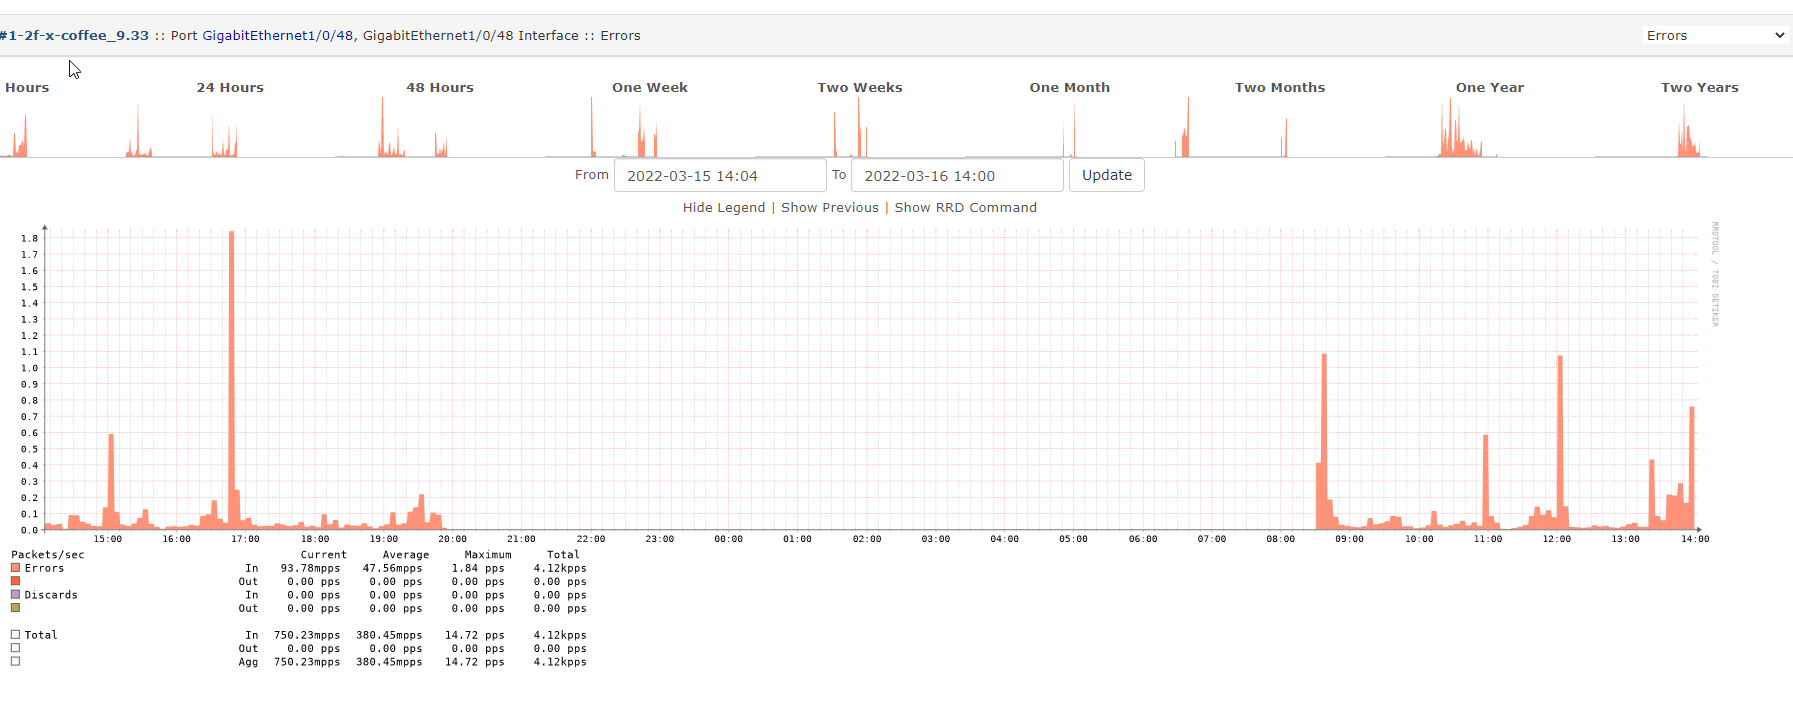
It’s just that the dashboard displays abnormally. Check the wrong package of the port, and the chart displays normally
If you click through to one of the error graphs, what do you see? Please share the screenshot.
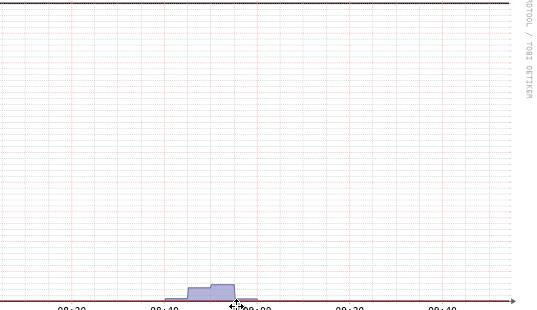
I suspect that the chart unit of measure is too large
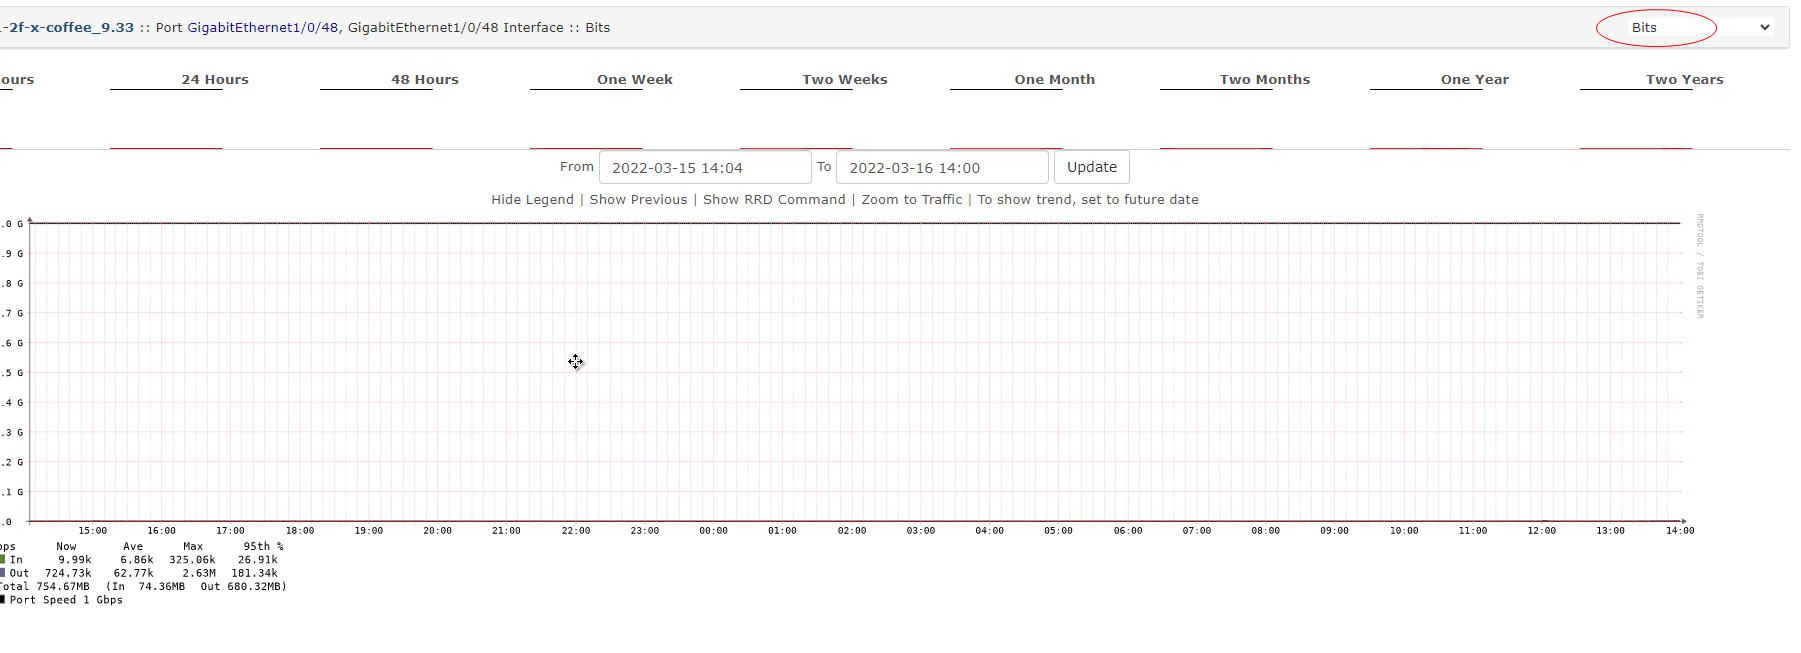
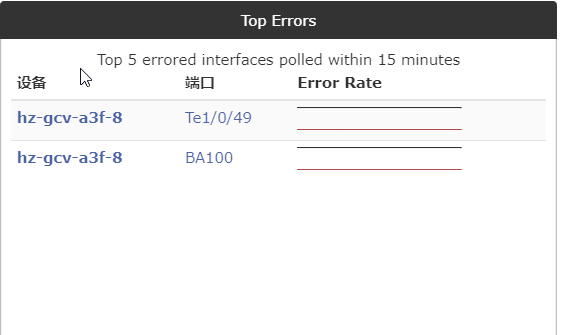
I think I found the reason because the port error view of the dashboard displays bits instead of error.
click through to one of the error graphs,display Bits
But I don’t know how to solve it
Well spotted, it was a simple fix, I’ve submitted a pull request: Fixed the top port errors widget returning bits graphs instead by laf · Pull Request #13860 · librenms/librenms · GitHub
This topic was automatically closed 90 days after the last reply. New replies are no longer allowed.