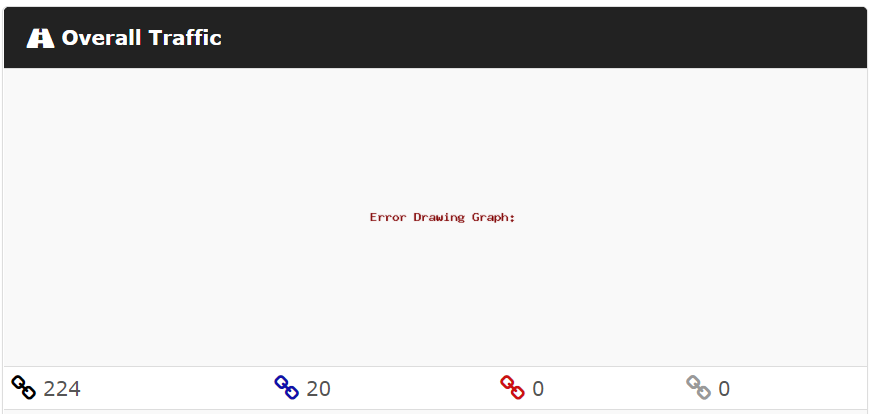
Since yesterday, devices with a large number of ports (e.g. large switch stacks, Cisco VSS, Cisco FEX) are failing to draw the Total Device Traffic graph that appears on the device overview page. This happens for a variety of device and OS types.
Everything looks good in validate.php, LibreNMS code is up to date, no errors are seen when running the rrdtool command from the CLI (it outputs what other threads have lead me to believe is the graph image). There is no indication of any errors when viewing the RRD Tool Output in the web UI. I’ve also restarted rrdcached, httpd, mariadb and the entire server but no difference.
Any help is appreciated. These graphs are handy. Thanks!
I came here to find this post. Got the same issue. Any fix yet?
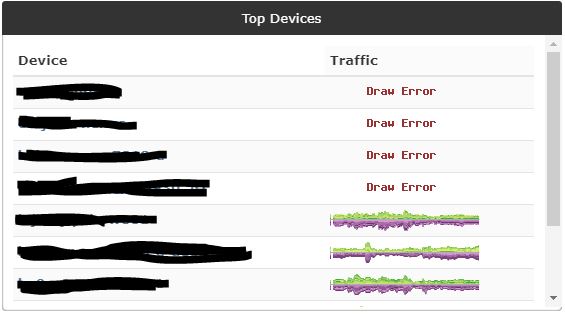
I found it happens with a recent update to LibreNMS. I have a backup of the previous day, and rolled back to it. Graphs showed up fine. Then, the following day, graphs are back to “Draw Error”. Only happens for switch stacks with many ports. but not all of them. And only for the “Overall Traffic” graph.
hello,
I have the same problem of displaying the “overall” graph on a device. I checked all the RRD files (366…) and all the individual graphs are there.
Before this post, I of course did a “./validate.php” and a “./validate.php -g rrdcheck”, which allowed me to verify that about 60 of our thousands of RRDs were damaged.
I deleted them and that fixed all the individual graph problems, except the overall one…
I have the same exact issue - devices with large numbers of interfaces not displaying Overall Traffic graphs. Validate is good and running the ./validate.php -g rrdcheck command did not find any damaged files, so @mac_prod’s suggestion didn’t work for me.
Anyone have any other suggestions?
Could you try this command on your LibreNMS server to find out the maximum length of a shell command: getconf ARG_MAX
On my machine, it would take about 2000 interfaces to hit the getconf ARG_MAX limit, which is 2MBytes. Each interface takes about 1kByte of space in the rrdtool command.
Seems to resolve it for me. I was also seeing broken poller performance graphs as well showing the same error and those are also working after applying 12868
hello,
without any additional modification, the display of the overall is now normal (after two days of waiting)! Change on librenms with cron daily.sh?
Yes @mac_prod. Update takes place automatically during daily.sh (unless you run stable version, which updates only once a month). So this is expected.
Bye