Hi, is there a specific reason why there’s no legend for which colors correlate to which interfaces on the “total device traffic” graph?
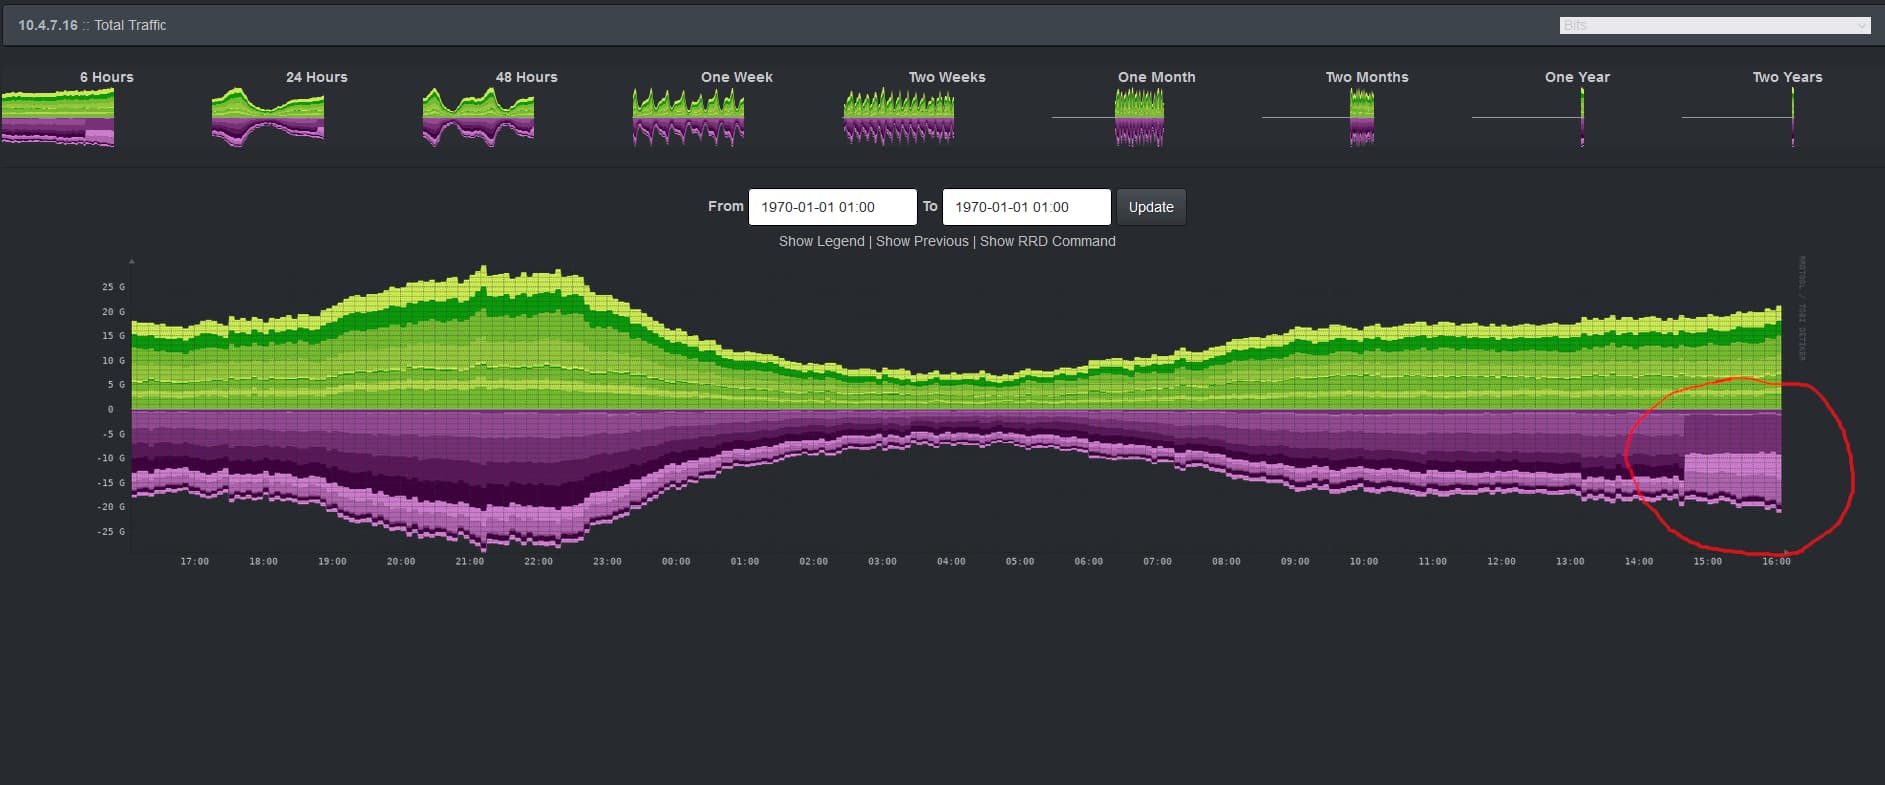
As you see in the picture, one link wasn’t able to transmit data and another kicked in, would be useful to directly see which link failed in the graph without having to scroll through the port list. I also don’t think that I could make an alert rule, as the link didn’t go down - just didn’t transmit data.
Any input?
Thanks