Transceiver Graphs Broken "Insufficient Permissions"

Validate PHP Results:

Component Version
LibreNMS 25.4.0-12-g234fa3277 (2025-04-17T02:21:54-04:00)
DB Schema 2025_03_19_205700_fix_ospfv3_ports_table (331)
PHP 8.2.26
Python 3.11.2
Database MariaDB 10.11.6-MariaDB-0+deb12u1
RRDTool 1.7.2
SNMP 5.9.3
===========================================

[OK] Composer Version: 2.8.8
[OK] Dependencies up-to-date.
[OK] Database Connected
[OK] Database Schema is current
[OK] SQL Server meets minimum requirements
[OK] lower_case_table_names is enabled
[OK] MySQL engine is optimal
[OK] Database and column collations are correct
[OK] Database schema correct
[OK] MySQL and PHP time match
[OK] Active pollers found
[OK] Dispatcher Service not detected
[OK] Locks are functional
[OK] Python poller wrapper is polling
[OK] Redis is unavailable
[WARN] IPv6 is disabled on your server, you will not be able to add IPv6 devices.
[OK] rrd_dir is writable
[OK] rrdtool version ok

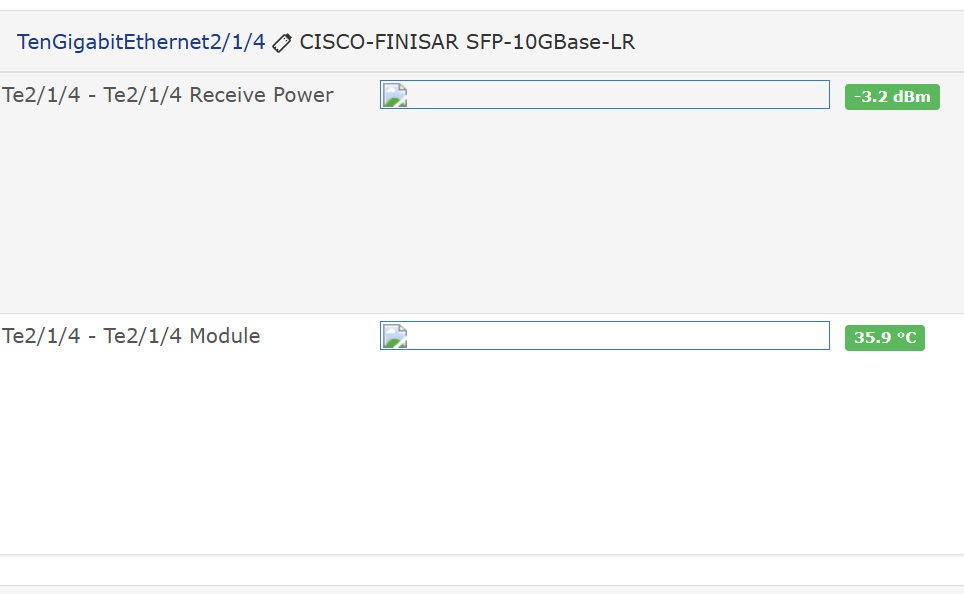
When viewing the general graphs after clicking on a device, transceiver graphs display a broken image, and when you click on them, they say “insufficient privileges”:


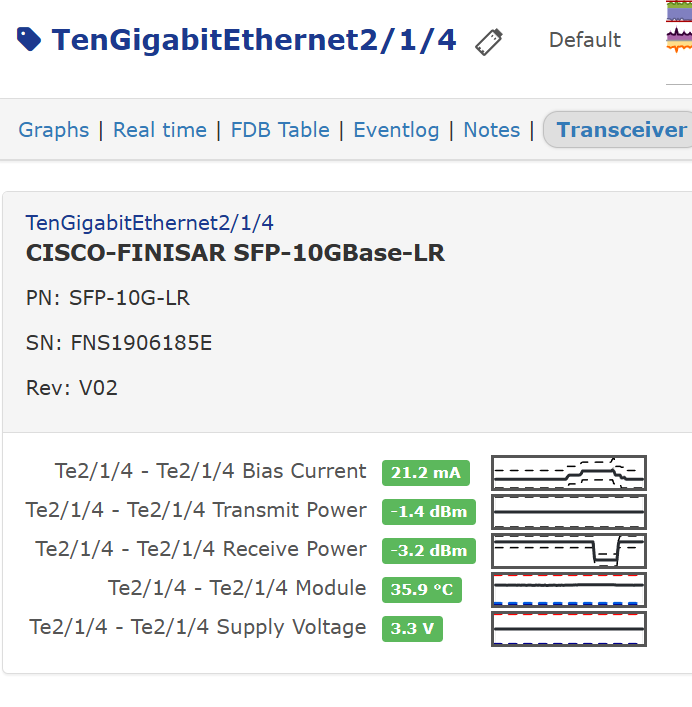
User is an admin role in the system, all other graphs display properly, and if you navigate to ports > transceivers, the graph is viewable and collecting the correct data:

rrd directory permissions are:
drwxrwxr-x+ 757 librenms librenms 28672 Apr 7 14:38 rrd

Does anyone have an idea of where I should look next?

Thanks!

3 Likes

Unfortunately I don’t have a solution but I wanted to chime in and say that I’m seeing the same thing this morning. I did try running daily.sh just to see if there was a fix out there yet, but no luck.

I did notice that if you click on the broken graph, it takes you to a broken link:
http://librenms.sampledomain.net/graphs/type=/from=-1d

Seems like there should be a type filled in there and possibly a sensor and id?

I also ran daily.sh, issue still persists. Good catch on the URL, that could be part of the issue.
Graph URL under general device:

https://librenms.mycompany.com/graphs/type=/from=-1d

Graph URL from under interface > transceivers:
https://librenms.mycompany.com/graphs/id=1/type=sensor_current/from=-1d

I’m having the same problem

Issue All "Transceivers" graph not drawn in Overview · Issue #17478 · librenms/librenms · GitHub is documenting this bug.

1 Like

Just noticed this issue here as well; seeing the same symptoms as the other replies. ./daily.sh does not rectify the issue.

Reverting this fixes the issue: Improve device-overview-graphs by murrant · Pull Request #17466 · librenms/librenms · GitHub

Just wanted to update those of you that didn’t want to revert to fix, it looks like as of today’s update/version (LibreNMS | 25.4.0-40-gdaa99b57a (2025-04-24T05:45:29-04:00) this issue is fixed.

Thank you devs, much appreciated.

1 Like

This topic was automatically closed 7 days after the last reply. New replies are no longer allowed.