Hello,
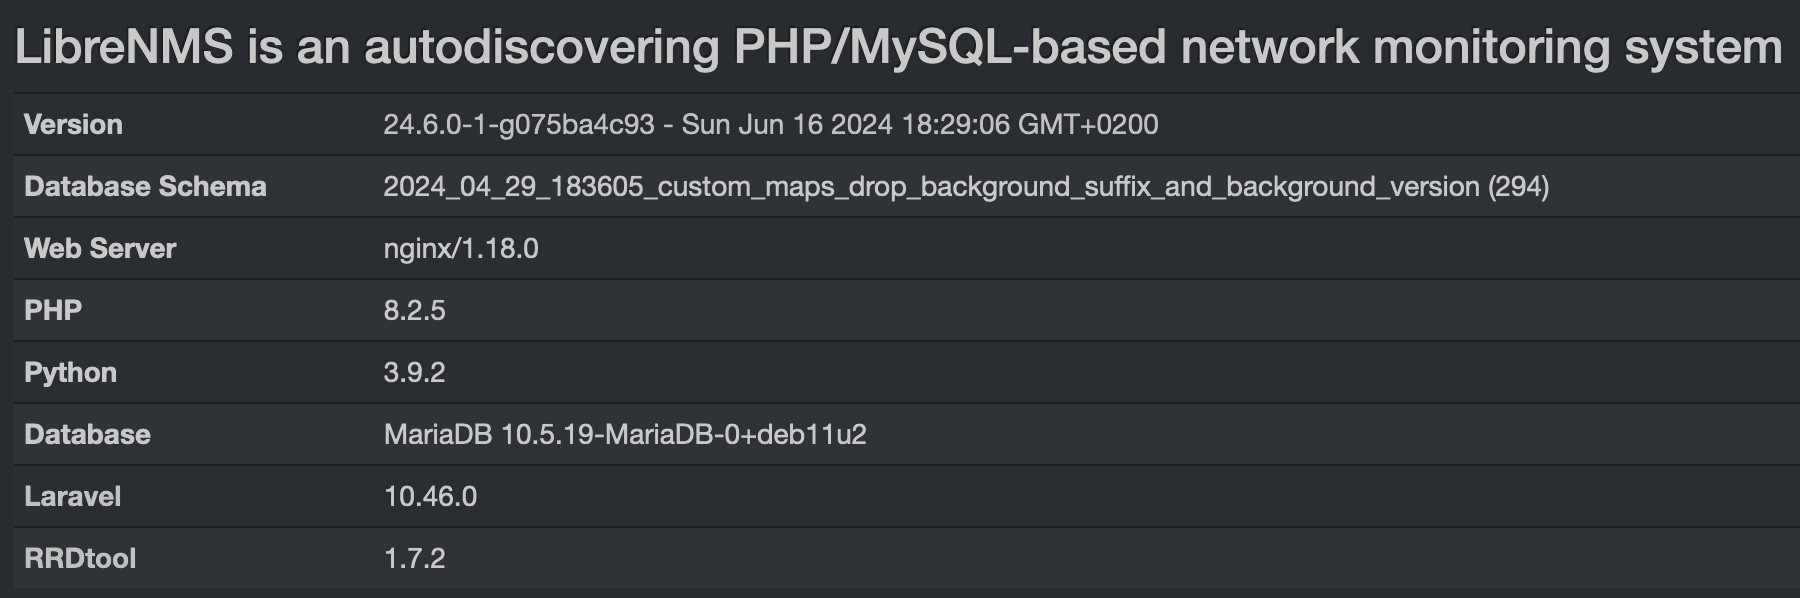
After upgrading LibreNMS to version 24.6.0-1-g075ba4c93 on Sunday - Sun Jun 16 2024 18:29:06 GMT+0200 the following problem occurred:
Selecting any network device and trying to click on any port ends with an error:
Whoops, looks like something went wrong. Check your librenms.log.
Check your log for more details. (librenms.log).
I don’t see any errors in librenms.log, libre keeps collecting statistics while there is no way to view the port.
The output I get when I try to run the ./validate.php script:
./validate.php: line 2: ?php: No such file or directory
./validate.php: line 4: /bin: Is a directory
./validate.php: line 5: addhost.php: command not found
./validate.php: line 6: addhost.php: command not found
./validate.php: line 7: syntax error near unexpected token (' ./validate.php: line 7: * Copyright (c) 2014 Neil Lathwood <laf (Neil Lathwood) · GitHubhttp://www.lathwood.co.uk/fa>’
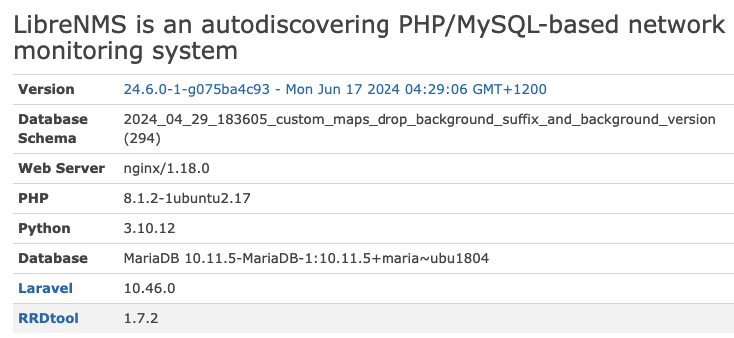
The environment in which librenms is running can be seen in the following screenshot:
[OK] Composer Version: 2.7.7
[OK] Dependencies up-to-date.
[OK] Database connection successful
[OK] Database Schema is current
[OK] SQL Server meets minimum requirements
[OK] lower_case_table_names is enabled
[OK] MySQL engine is optimal
[OK] Database and column collations are correct
[OK] Database schema correct
[OK] MySQL and PHP time match
[OK] Active pollers found
[OK] Dispatcher Service is enabled
[OK] Locks are functional
[OK] Python wrapper cron entry is not present
[OK] Redis is unavailable
[OK] rrdtool version ok
[OK] Connected to rrdcached
[WARN] Your install is over 24 hours out of date, last update: Sun, 16 Jun 2024 16:29:06 +0000
[FIX]:
Make sure your daily.sh cron is running and run ./daily.sh by hand to see if there are any errors.
Hi similar Issue here.
Something is up with ports-tab.
When I look at a device port-tab, I can only see ports that have “Ignore alert tag” and “Disable polling” OFF
With port settings:
A port with “Disable polling” OFF and “Ignore alert tag” OFF will show in the port-list for the device.
If i put an port “Disable polling” OFF and “Ignore alert tag” ON it will NOT show in the port-list.
For me it seems like “Ignore alert tag” now has dubble functions, it controls both alert and polling, while “Disable polling” still controls polling.
So for a interface to be polled and shown in the port list for the device BOTH “Disable polling” and “Ignore alert tag” has to be OFF.
However.
A port that is NOT listed in the ports-tab now. Is still listed on the Overview-tab page under Overall Traffic.