A big thank you to all of you who took the time out to feedback on LibreNMS and how it works for you. We’re using the data to try and understand what people think of the software, what you’d like to see the most from it and for this survey, gauge the version of PHP people are willing to run, more on that later.
In total we had 76 respondents.
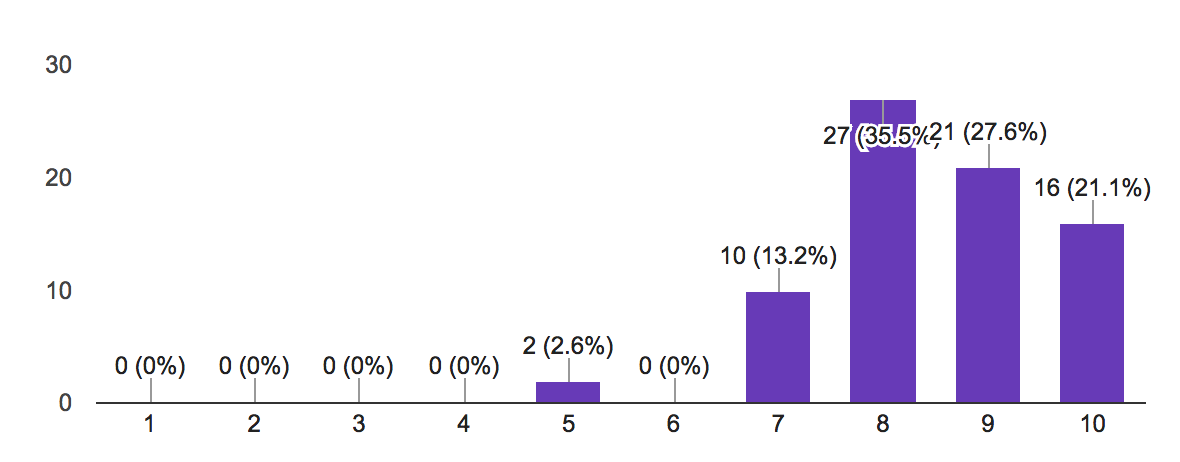
Q. How happy are you with the LibreNMS software?
A.
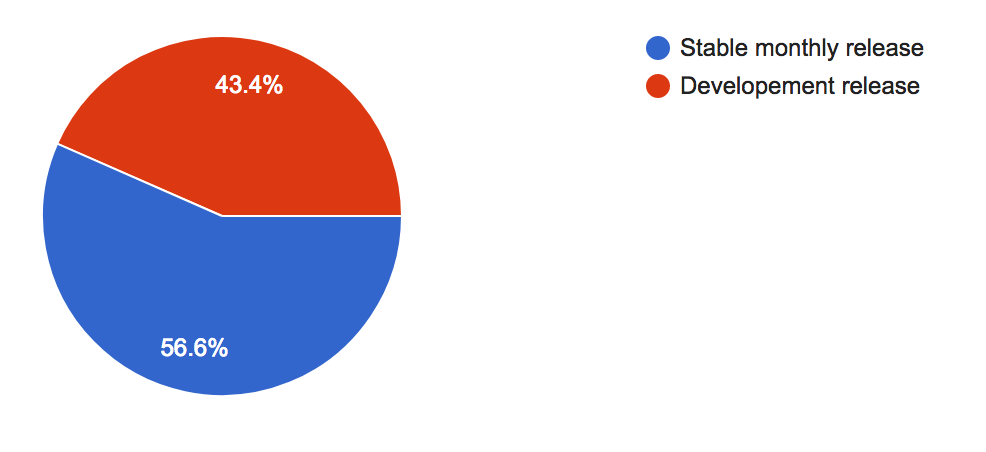
Q. Do you use the stable monthly branch or the development branch which is updated most days?
A.
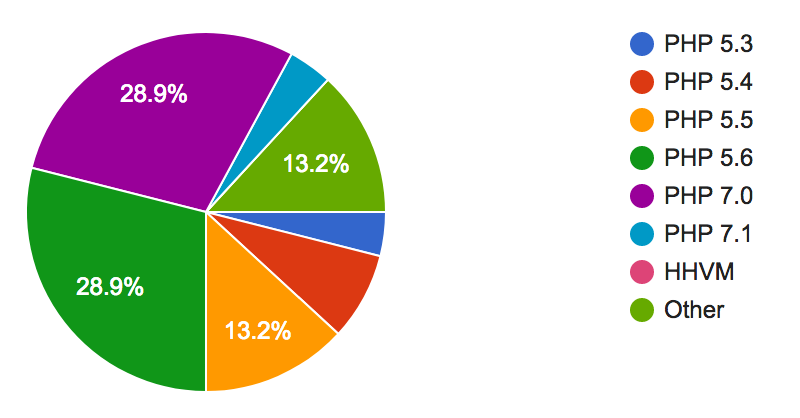
Q. What version of PHP do you currently use for LibreNMS?
A.

Q. What minimum version of PHP do you think LibreNMS should support?
A.
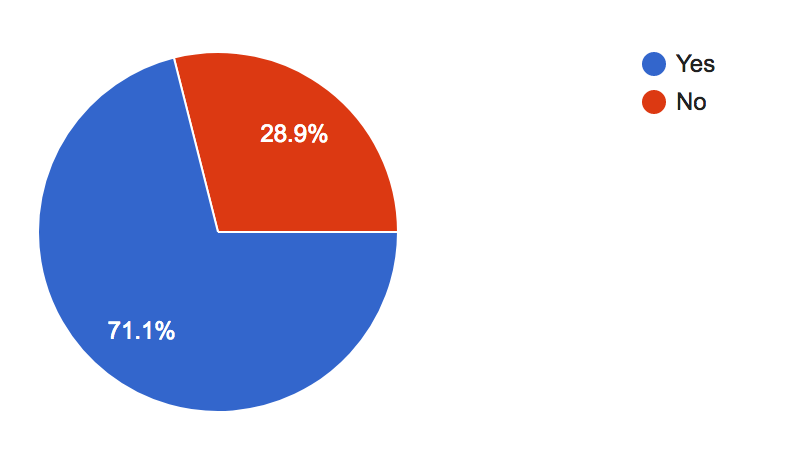
Q. Do you contribute anonymous data to https://stats.librenms.org?
A.
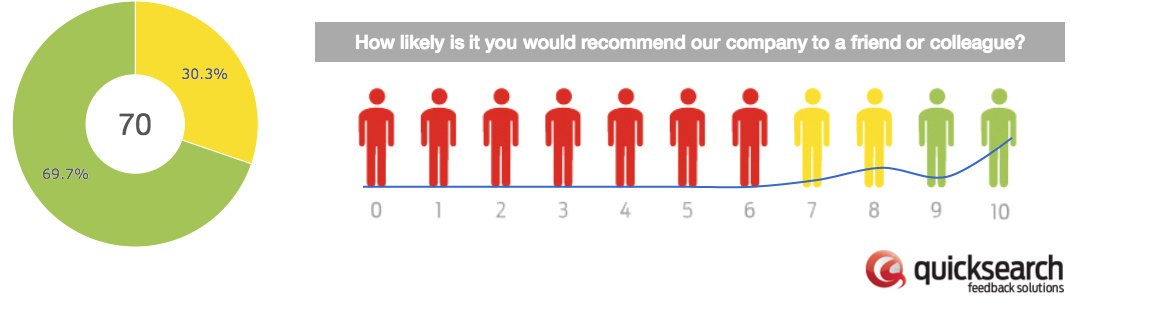
Q. How likely is it that you would recommend LibreNMS to a friend or colleague?
A.
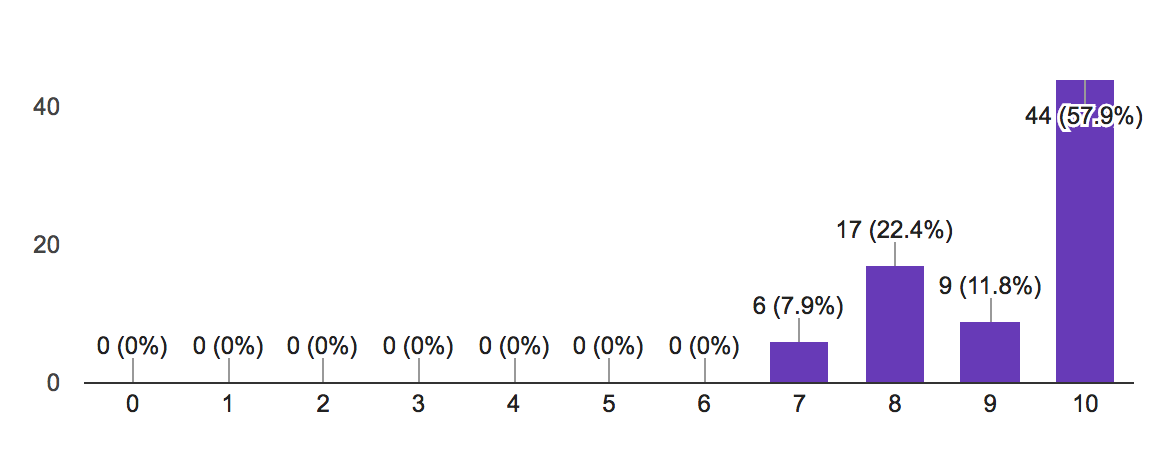
This gives us an NPS score of 70.
What are your top two features that you would like to see?
- Some more modern network map, faster multithreaded polling for certain interfaces, and more integration for Grafana or other TS databases.
- Native WMI support, integrated syslog-ng/greylog (no post install installs), and defined maintenance window per device groupings.
- Currently complete - none I could think of.
- High Availability
- HP ilo and blc
- Eigrp support and eigrp support
- SSH access to device via applet on Librenms server instead of from user machine. Also please add option to go via another SSH jumphost.
- Eigrp
- Simpler interface for alerting configuration and easier to add custom devices
- Netflow and some reporting capabilities
- Faster more scaleable poller, prometheus/influxdb support for graphs instead of rrd
- Setup alerts with different accounts/email. Such as simple nagios notifications
- Device dependencies or "nested’ devices, and display up/down status of devices in the network map
- Better alerting, trending
- More ways of viewing devices. My device view is by ip since I added that way but I wanna see them by host name.
- Ability to set a global default dashboard when using AD authentication (feature doesn’t work through GUI). Ability to give global read access without visibility of end stations i.e. IP and MAC addresses. A kind of privacy view mode?
- Mobile friendly and custom rule based alerts.
- Ericsson PDUs and FortiOS 5.4.x
- Asterisk PBX, more devices
- A scan network button for changes. An automated install process from a fresh server to ready. Answer a few questions and its ready for use.
- Custom OID/ device creation in the UI. And way better pojg monitoring. Like get rid of smokeping and just give us the ability to add devices for ping only with no fuss
- Poll & search FBD table and snmp trap support
- More attractive dashboard, integration of alerts with WhatsApp
- Graphite/InfluxDB Backend, Server Monitoring
- Status boxes like in the first page of the observium, event log like the observium
- Easy to add unsupported hardware and submit it to codebase
- Billing on powerconsumption on pdus
- Looking forward to the poller service being considered stable.
- Better alerting and more things added
- Integration with an ipam. Integrated netflow
- Agent reporting over WAN is the only thing I can see missing
-
- Better integration of network map 2. Ability to choose which alerts will trigger the transport (either all or select few)"
- Built in default alert settings
- Routing table view for L3 devices.
- Native ability to run ICMP only checks and native network weathermaps.
- (1) ID-numbers on alerts to allow grouping of problems in mail threads. (2) Better integration with Time Series Databases to use the data in Graphana and similar.
- Example / shareable “dashboards”. I made one I like, but I’m sure there’s cooler stuff people are doing. The other feature is a cupsd application support. I gave up on SNMP on my Samsung printer from hell, but cups serves this printer; knows the toner level, etc. Basically I’d like the level of printer support that already exists for SNMP printers as an app (snmp extension ideally) I could run on my cups server to view all my printer’s status. Bonus 3rd feature I don’t think you can add but I’d like: “trim_tobias” for SVG graphs.
- Easier adding simple monitors for specific OIDs (like you know temperature OID and just want to graph that)
- Wallboard screen for NOC and better Network map
- Some way to view the configuration file of a network device, being able to search the configurations of our switches.
- When adding a device and the SNMP fails, not to drop all the settings leave the fields still populated with the previous information, some weird older devices with non intuitive setups that don’t say if they use MD5 or SHA or AES or DES, this is a minor complaint, but could save some people a bit of time."
- easy peasy MIB importing support
- Setup alerts with diffrents accounts/email. Such as simple nagios notifications
- comparision tools and search options for the “most” of something. The most used interface, the most cpu used server… etc.
- better graphs, better first panel (default)
- Aruba Devices added support. Setup different groups for email alerts… Server Admins and Network Admins.
- Scheduled maintenance per alarm, easier/improved integration of services
- Better dashboard, more nicely drawed graphs anno 2017 standards
- Unlikely but I would like to see a Dark mode.
- Service monitoring, Passive / push monitoring
- Juniper Virtual Chassis and better FortiGate support with VPN /ospf monitoring
- Full API support for billing
- Bandwidth prediction; (supported) Weathermap integration
- stability, precise software requirement checks on the validate.php
- Network Map(including STP), Traffic map
- Ability to add custom devices and/or OS from webgui. SSH server, ie. single point to log in to all devices.
- Built in weathermap, preferrably with nice integrated UI.
- ¯_(ツ)_/¯
- Options via web GUI for backup, restore/migrate & more config options via web GUI instead of .conf files.
- Only just started using librenms since 2 days. Too early to tell!
- Customizable network map, rewritten alerting system
- Android app, fortios 5.4 and 5.6
- Really just one; our storage devices (primarily Nimble and HP MSA) do not show anything related to storage; we get CPU and network consumption, but nothing about disk health, storage usage, luns/volumes, snapshots, I/O throughput/latency, etc.
- Better / More configurable mapping (preferably improving upon weathermap-style); Better generic OID support; would be nice to be able to custom configure a single OID to be polled on a host and either graph it or map it to a set of possible values/states, without having to create a discovery extension.
- As I eared: Professional service and a more simple way to install from scratch
- Ability to add devices with just ping checks.
- Windows Monitoring Support
- Better application integration and give it some priority or assign a dev to work on it
- More control over alerting emails and the kind of information in them
What is your overall impression of LibreNMS?
This text will be hidden- I’m a big fan of how easy it is to get going and the very wide database of devices supported out of the box. I have only run into a couple of devices that didn’t work great right away.
- Excellent product
- Very positive, easy to get going, would be nice with customizable graphs
- It’s very good software
- Very good gui
- Amazing tool with an incredibly responsive community.
- Very good!
- Great product, love that it’s free and support is always there in the irc channel
- Overall very impressed. Ubuntu install very straightforward; a few minor typos in the CentOS installation guide. Sizing of the VM to support the number of devices took a few iterations. In my environment it feels like there are too many things “on” by default for Cisco SNMP polling, but working through the config has fixed this.
- Was using Observium, but liked the ability to create custom dashboards
- Not as attractive as observium
- Work in progress, but very promising
- Very good. Fairly easy and straight forward to setup.
- Very well rounded
- Good overall. It’s not quite full functioned enough to take over our installs of netdisco (mac address/arp table mappings), zenoss (snmp traps) and cacti (public facing IPv6 graphs) but you guys are quickly adding features. I think my favorite thing is that your refactoring code and making significant improvements to my installs every week.
- A very good tool
- It’s just great!
- Very good
- Excellent!
- good
- Useful software, friendly developers, though I find it a bit resource heavy, mostly rrdtool-related I think (even with rrdcached).
- I love it.
- I’ve used librenms for over a year now, and it continues to get better and more professional every day. I would rather use it than if solarwinds was free
- Love it. Simple to setup and use and provides enormous amount of insight into a network’s structure.
- Awesome, well built
- It’s well maintained and well supported by the community.
- A fantastic open source project
- Very nice program!
- It’s one of the only software projects I’ve contributed too (even if Tony is re-writing my “php written by a shell scripter so dear god …” into something object oriented and pretty)
 so naturally I’m a fan.
 - Very useful tool
- good. Stable and fast
- Good, the stability and performance is nice, we ran several difference products and waiting for the web GUI to do anything is frustrating, the fact LibreNMS just goes when i click buttons is amazing, plus not java or flash player required.
- fantastic.
- Very good gui
- A flexible and powerfull tool to monitorize infrastructure
- a bit messy, but works nice.

- Its been Great. I like how it always getting better.
- Terrific NMS, very active development
- Good, but still community work
- Solid as hell. This is by far the best NMS I’ve used. Good updates, communicative on social media, good documentation, friendly community.
- Fantastic product! Keep up the good work
- Just does the job
- Very good and Nice to see rapid development
- Very good but alerting can be vague sometimes
- Stable and very useful
- looks good,haven’t used it full potential yet its missing a network map.
- very slick, professional and easy to use. Almost as good a paid systems
- Superb, easy replacement for basic Nagios + Cacti functionality.
- Love it <3
- Very good! Amazing software and support via reddit, easy to use and implement.
- First impression is “quite ok”. I’m not sure what I’m missing at the moment. I’m now trying to find out how the apps work and how to add custom apps.
- High five!
- It’s such an awesome software, started using it about a month ago, wish i’d found it sooner?
- Clean, modern-looking NMS with excellent presentation of data. Very easy to use.
- A great product; looking forward to continuing to expand our usage of it as well as contribute more back to the community in the process.
- A true love story
- Nice Fork from Observium
- AMAZING. Fast, Easy to Use, Deploy and GO. Very active and friendly community.
- It’s the only option I will use for SNMP monitoring, nothing else fits
- Very positive.
- Pretty good.
- decent for network device and ups monitoring
- Great community, easy to hack on, very stable
- Great concept. Wonderful interface. Not engineered to scale.
- Easy, fast, good looking
- Love it !
- Very usefull
- Overall impression is good. I am always happy to see new and useful features. Sometimes the small polishing things are the nicest.
- Awesome
General feedback:
- For patch management, it would be nice for Librenms to be included in the normal system repo’s…ie apt-get install librenms.
- Thank you
- Awsome product
- Keep up the excellent work. I really appreciate all the effort you have put into this project.
- Please check if you can improve the alerts feature, so we can only run libre and not need to run two
- Make setting up alerts easier!
- Visually less attractive than Observium but reasonably feature complete – could use a up to date how-to-add-a-new-device-type doc.
- Continue improving
- You could do with a “validate” device option that takes the data graphed from poller/discovery times and provides feedback on slow or unused modules for the device. For instance the per port polling can easily knock of 50seconds from some of our devices and it’s fairly easy to validate… Anything to get those features enabled based on “device” testing instead of user knowledge would be helpful.
- Keep up the good work
- I’ve brought LibreNMS into every job I’ve worked at so far and I have no plans on stopping.
- Well done so far! Quick and competent response on bug reports.
- I recommend it on Ubiquiti forums and occasionally on reddit but I don’t really have friend / colleagues who would use something like this.
- Please check if you can improve the alerts feature, so we can only run libre and not need to run two
- great job keeping the open, in open source !
- I’m using LibreNMS at a school district and we monitor about 300 devices and 13,000 interfaces and WAPs . And we love it. Keep up the good work!
- adopt mibs faster, Distinguish from others via your fast code write capebilities
- Keep up the fantastic work! You are doing a great job.
- Keep up the good work
- that’s kinda work… but the code is a mess. It needs a deep review with a strong code guidelines and formatting, especially with php
- We love the simplicity of the user interface and the clean presentation, and how resource-efficient it is. Also it’s been pretty much trouble-free. It just keeps plugging along doing its thing and getting automatic updates.
- Recommend you guys to a lot of people and everyone seems to be happy when they have it up and running
- Comparable to Solarwinds Orion NPM, significantly better front end, equal on responsiveness, significantly worse on alerting capabilities