I have ADSL cards that have a possibility of hundreds of interfaces that could be polled. I’ve went through and disabled all but 15 or 20 total interfaces. I’ve followed the performance suggestions but polling is still taking longer then 5 minutes. I have about 6 modules enabled. I would like to see what is being polled thats taking so long.
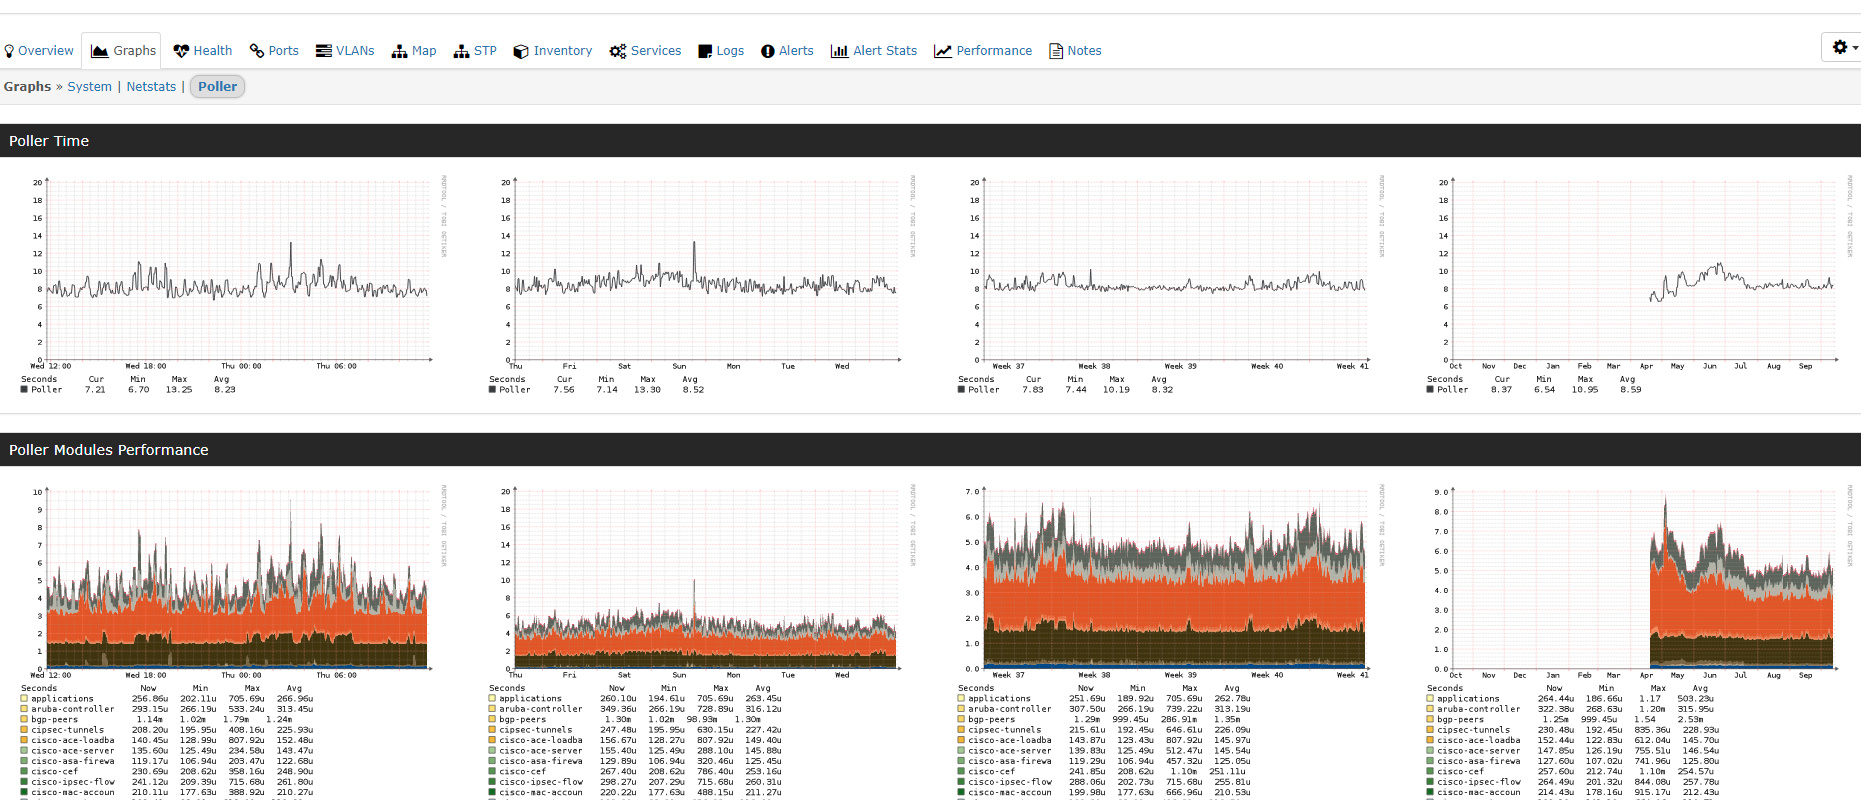
In the web UI go to the little gear icon then pollers then poller history.
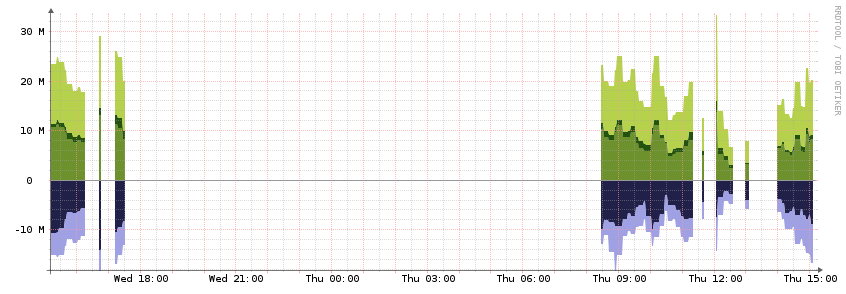
For the device itself, you can look in graphs → Poller.
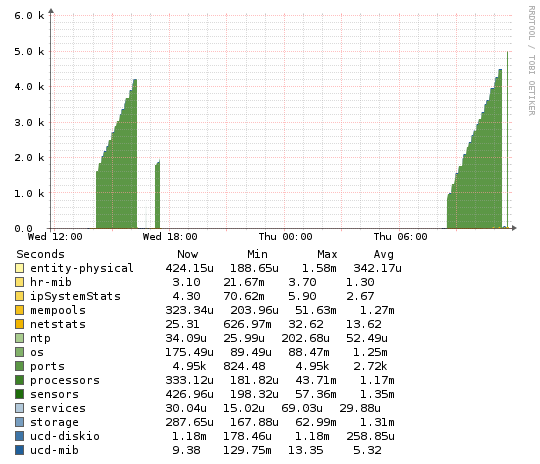
This is what I’m getting.
Yes, and looks like ports are still polling slow.
Is there a way to verify that its only polling the ports I have enabled and not all of them?
yes goto capture then poller
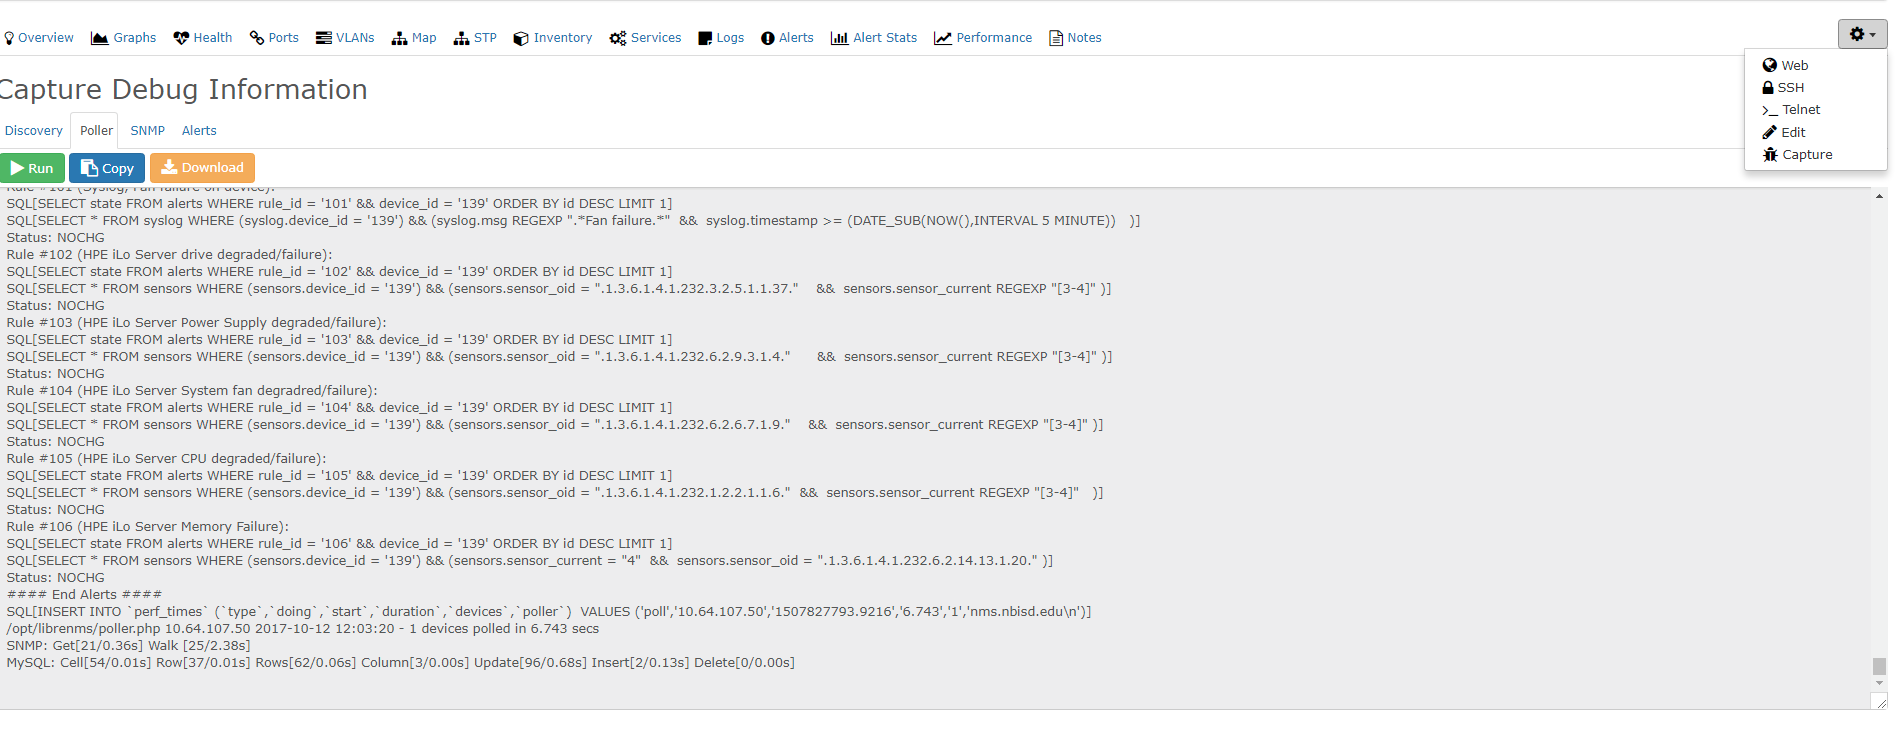
in that poll debug should show you everything that is being polled for that device.
Looks like its timing out -
you can run a poller debug from the cli
run ./poller.php -h HOSTNAME -d
It runs this then hangs. I’ve given it a hour to continue but it never did.
librenms@librenms:~$ ./poller.php -h XXXX -d
LibreNMS Poller
Version info:
Commit SHA: 3381b401f91edbd0caa8b2e67802f34c4f2ab0af
Commit Date: 1507641527
DB Schema: 210
PHP: 7.0.22-0ubuntu0.16.04.1
MySQL: 10.0.31-MariaDB-0ubuntu0.16.04.2
RRDTool: 1.5.5
SNMP: NET-SNMP 5.7.3
==================================DEBUG!
Starting polling run:
SQL[SELECT * FROM devices WHERE disabled = 0 AND hostname = ‘XXXX’ ORDER BY device_id ASC]
SQL[SELECT * FROM devices_attribs WHERE device_id = ‘23’]
Hostname: XXXX
Device ID: 23
OS: generic
SQL[INSERT INTO device_perf (xmt,rcv,loss,min,max,avg,device_id,timestamp) VALUES (‘3’,‘3’,‘0’,‘8.04’,‘26.4’,‘15.8’,‘23’,NOW())]
SNMP Check response code: 0
SNMP[/usr/bin/snmpget -v2c -c COMMUNITY -OQnUst -m SNMPv2-MIB:HOST-RESOURCES-MIB:SNMP-FRAMEWORK-MIB -M /opt/librenms/mibs -t 5 -r 2 udp:HOSTNAME:161 sysUpTime.0 sysLocation.0 sysContact.0 sysName.0 sysObjectID.0]
sysUpTime.0 = 3583329359
sysLocation.0 = XXXX
sysContact.0 =
sysName.0 = XXXX
sysObjectID.0 = enterprises.55*
SNMP[/usr/bin/snmpget -v2c -c COMMUNITY -OvQ -m SNMPv2-MIB:HOST-RESOURCES-MIB:SNMP-FRAMEWORK-MIB -M /opt/librenms/mibs -t 5 -r 2 udp:HOSTNAME:161 sysDescr.0]
zhone-mxk
SNMP[/usr/bin/snmpget -v2c -c COMMUNITY -OQnUst -m HOST-RESOURCES-MIB:SNMP-FRAMEWORK-MIB -M /opt/librenms/mibs -t 5 -r 2 udp:HOSTNAME:161 snmpEngineTime.0 hrSystemUptime.0]
snmpEngineTime.0 = No Such Instance currently exists at this OID
hrSystemUptime.0 = No Such Instance currently exists at this OID
Uptime seconds: 35833294
RRD[update XXXX/uptime.rrd N:35833294 --daemon unix:/var/run/rrdcached.sock]
Uptime: 1 years, 49 days, 17h 41m 34s
SQL[SELECT lat,lng FROM locations WHERE location=‘XXXXX’ LIMIT 1]
Using cached lat/lng from other device
Modules status: Global- OS Device Module [ unix-agent ] disabled globally.
Modules status: Global+ OS Device- Module [ os ] disabled on host.
Modules status: Global+ OS Device- Module [ ipmi ] disabled on host.
Modules status: Global+ OS Device- Module [ sensors ] disabled on host.
Modules status: Global+ OS Device- Module [ processors ] disabled on host.
Modules status: Global+ OS Device- Module [ mempools ] disabled on host.
Modules status: Global+ OS Device- Module [ storage ] disabled on host.
Modules status: Global+ OS Device- Module [ netstats ] disabled on host.
Modules status: Global+ OS Device- Module [ hr-mib ] disabled on host.
Modules status: Global+ OS Device- Module [ ucd-mib ] disabled on host.
Modules status: Global+ OS Device- Module [ ipSystemStats ] disabled on host.
Modules status: Global+ OS Device
Load poller module ports
Caching Oids: SNMP[/usr/bin/snmpbulkwalk -Cr10 -v2c -c COMMUNITY -OQUs -m IF-MIB -M /opt/librenms/mibs -t 5 -r 2 udp:HOSTNAME:161 ifXEntry]
That’s because your device isn’t sending valid data then for the standard IF-MIB
did you try https://docs.librenms.org/#Support/Performance/#snmp-max-repeaters for this device maybe?
yes when I tested above 10 it started slowing down dramatically. When I run the Poller from CLI, is it also still being run through cron? Maybe its timing out because of running 2 instances?