Hello, Is it possible to also monitor a website using LibreNMS? If yes, can you please help me how? Thanks
1 Like
If you mean making an http / https query to a website to see if it responds, yes.
You do this using the “Services” feature using Nagios plugins:
This may require you to install the nagios plugins in your operating system, which will vary depending on what Linux distribution you’re using.
I run LibreNMS on Ubuntu server and from memory I installed an apt package called monitoring-plugins.
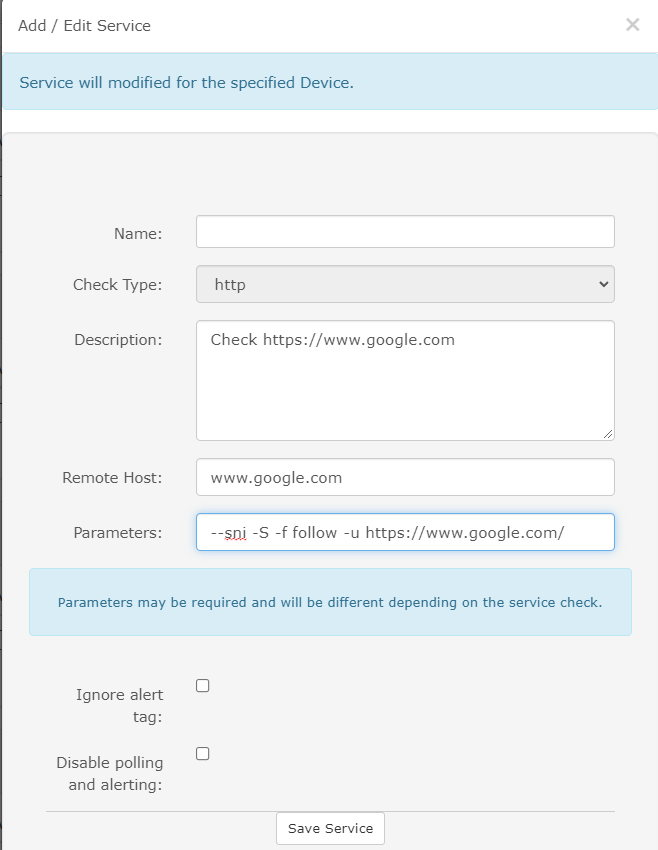
When the plugins are installed and you have Services enabled in LibreNMS you can create a service. For example here is one testing google:
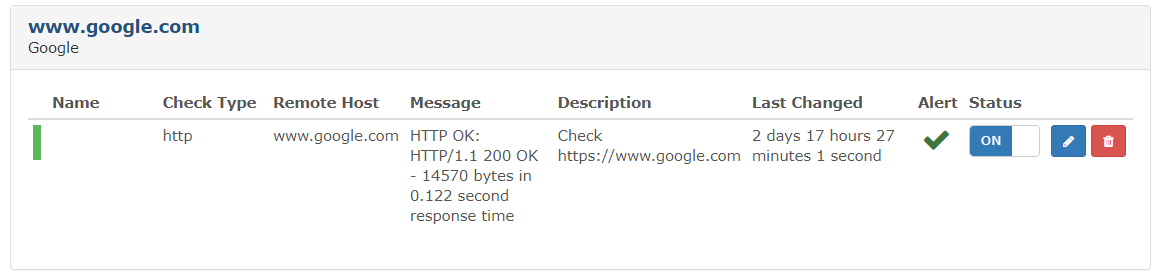
Here is what the results look like when there are successful responses:
To be alerted if this fails you will need to set up some alerts and possibly alert template for services. There are some templates in the alert template library to alert on services that are in warning or critical state.
Nagios plugins are not part of LibreNMS so you will need to google for them to find their documented command line options. (Or run them manually from the command line to explore their options)
1 Like
Hello DBMandrake,
Thanks for the info. I’m also using ubuntu and this will be a great help for me. I’ll try it on my end and let you know the status. Really appreciate it.
Hello DBMandrake,
I got it working as you mentioned by installing monitoring-plugins. Now the challenge is for me is creating the alert rule if the website is down.
Thanks a lot for the help.
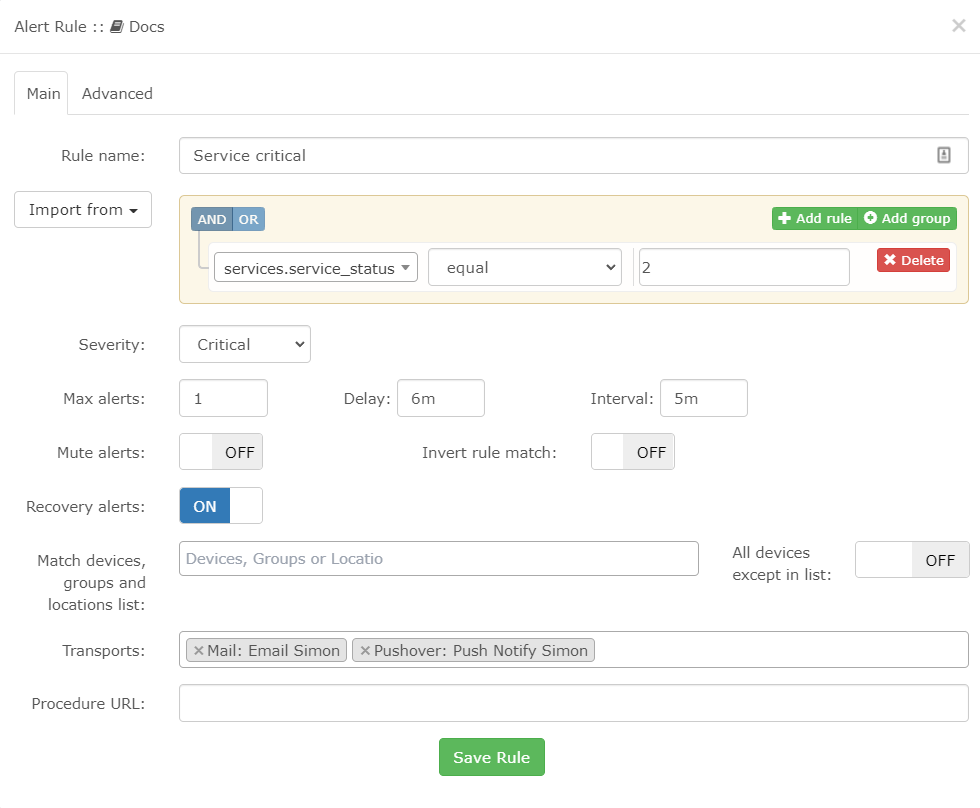
You want both the service warning and service critical alerts available in the alert templates, as a service can have both warning and critical states. (Depending on the return code from the script…) Here are mine:
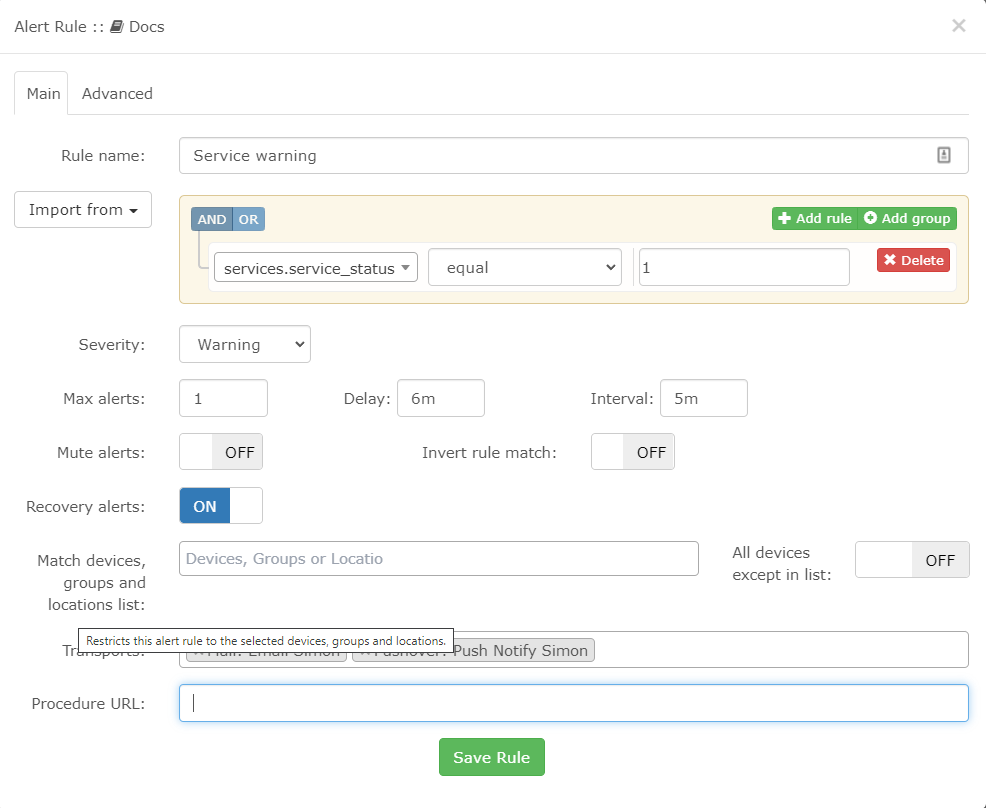
I have delay set to 6 minutes so that one failed polled doesn’t send me an alert, it has to fail on two consecutive 5 minute polling intervals to alert me.
Here is my alert template which is applied to the two service alerts:
Alert title:
Alert for device {{ $alert->sysName }} - @if ($alert->name) {{ $alert->name }} @else {{ $alert->rule }} @endif
Recovery title:
Device {{ $alert->sysName }} recovered from @if ($alert->name) {{ $alert->name }} @else {{ $alert->rule }} @endif
Template:
Device Name: {{ $alert->sysName }}
@if ($alert->os != 'ping')
Operating System: {{ LibreNMS\Config::getOsSetting($alert->os, 'text') }} {{ $alert->version }}
@endif
@if ($alert->hardware)
Hardware: {{ $alert->hardware }}
@endif
@if ($alert->location)
Location: {{ $alert->location }}
@endif


{{ $alert->title }}
Severity: {{ $alert->severity }}
Rule: @if ($alert->name)
{{ $alert->name }}
@else
{{ $alert->rule }}
@endif
@if ($alert->state == 0)
Time elapsed: {{ $alert->elapsed }}
@endif
Timestamp: {{ $alert->timestamp }}
Unique-ID: {{ $alert->uid }}

@if ($alert->faults)
Faults:

@foreach ($alert->faults as $key => $value)
#{{ $key }}: Service: {{ $value['service_ip'] }}
Description: {{ $value['service_desc'] }}
Message: {{ $value['service_message'] }}

@endforeach
@endif
Hello DBMandrake,
This is really a great help. What is the services.service_status = 1 and 2 means?
Thanks
Nagios plugins have different return codes. 0 means everything is OK, 1 means warning, 2 means critical.
For example on the http test the webserver responding to your test with a 404 error would be a warning state while the web server not even responding at all (TCP port closed) would be a critical state.
This is why you need alerts for both warning and critical states for services.