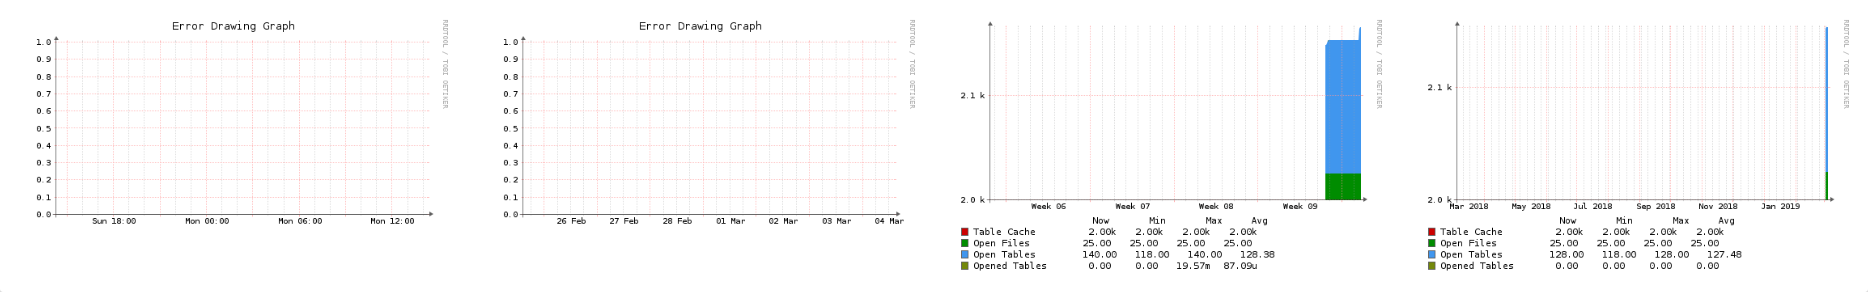
Hello i have been with trouble lately, rdd graph seem not be broked in my installation (i got some serious I/O issues because i poll 150+ devices every minutes. here is the screenshot :
the 3rd graph seem to work perfectly but not the 2 first.
RRDTool Command

rrdtool graph /tmp/qag5pZqd2M6Q7eRn  --alt-autoscale-max --rigid -E --start 1551618600 --end 1551705000 --width 1728 --height 503 -c BACK#EEEEEE00 -c SHADEA#EEEEEE00 -c SHADEB#EEEEEE00 -c FONT#000000 -c CANVAS#FFFFFF00 -c GRID#a5a5a5 -c MGRID#FF9999 -c FRAME#5e5e5e -c ARROW#5e5e5e -R normal --font LEGEND:8:DejaVuSansMono --font AXIS:7:DejaVuSansMono --font-render-mode normal --alt-autoscale-max --rigid -E --start 1551618600 --end 1551705000 --width 1728 --height 503 -c BACK#EEEEEE00 -c SHADEA#EEEEEE00 -c SHADEB#EEEEEE00 -c FONT#000000 -c CANVAS#FFFFFF00 -c GRID#a5a5a5 -c MGRID#FF9999 -c FRAME#5e5e5e -c ARROW#5e5e5e -R normal --font LEGEND:8:DejaVuSansMono --font AXIS:7:DejaVuSansMono --font-render-mode normal COMMENT:'Keys                   Now       Min       Max     Avg\l' DEF:KRRs0=192.168.2.154/app-mysql-24.rrd:KRRs:AVERAGE  DEF:KRRs0min=192.168.2.154/app-mysql-24.rrd:KRRs:MIN  DEF:KRRs0max=192.168.2.154/app-mysql-24.rrd:KRRs:MAX  AREA:KRRs0#CC0000:'read requests    ' GPRINT:KRRs0:LAST:%5.2lf%s GPRINT:KRRs0min:MIN:%5.2lf%s GPRINT:KRRs0max:MAX:%5.2lf%s GPRINT:KRRs0:AVERAGE:'%5.2lf%s\n' COMMENT:'\n' DEF:KRs1=192.168.2.154/app-mysql-24.rrd:KRs:AVERAGE  DEF:KRs1min=192.168.2.154/app-mysql-24.rrd:KRs:MIN  DEF:KRs1max=192.168.2.154/app-mysql-24.rrd:KRs:MAX  AREA:KRs1#008C00:'reads            ':STACK GPRINT:KRs1:LAST:%5.2lf%s GPRINT:KRs1min:MIN:%5.2lf%s GPRINT:KRs1max:MAX:%5.2lf%s GPRINT:KRs1:AVERAGE:'%5.2lf%s\n' COMMENT:'\n' DEF:KWR2=192.168.2.154/app-mysql-24.rrd:KWR:AVERAGE  DEF:KWR2min=192.168.2.154/app-mysql-24.rrd:KWR:MIN  DEF:KWR2max=192.168.2.154/app-mysql-24.rrd:KWR:MAX  AREA:KWR2#4096EE:'write requests   ':STACK GPRINT:KWR2:LAST:%5.2lf%s GPRINT:KWR2min:MIN:%5.2lf%s GPRINT:KWR2max:MAX:%5.2lf%s GPRINT:KWR2:AVERAGE:'%5.2lf%s\n' COMMENT:'\n' DEF:KWs3=192.168.2.154/app-mysql-24.rrd:KWs:AVERAGE  DEF:KWs3min=192.168.2.154/app-mysql-24.rrd:KWs:MIN  DEF:KWs3max=192.168.2.154/app-mysql-24.rrd:KWs:MAX  AREA:KWs3#73880A:'writes           ':STACK GPRINT:KWs3:LAST:%5.2lf%s GPRINT:KWs3min:MIN:%5.2lf%s GPRINT:KWs3max:MAX:%5.2lf%s GPRINT:KWs3:AVERAGE:'%5.2lf%s\n' COMMENT:'\n' --daemon unix:/var/run/rrdcached.sock

RRDTool Output

ERROR: rrdc_fetch: Got 283 lines, expected 295
====================================
Component | Version
--------- | -------
LibreNMS  | 1.48.1-90-g3ad698ff9
DB Schema | 2019_02_10_220000_add_dates_to_fdb (132)
PHP       | 7.2.15-1+0~20190209065123.16+stretch~1.gbp3ad8c0
MySQL     | 5.7.24-27
RRDTool   | 1.6.0
SNMP      | NET-SNMP 5.7.3
====================================

[OK]    Composer Version: 1.8.4
[OK]    Dependencies up-to-date.
[OK]    Database connection successful
[OK]    Database schema correct
[WARN]  Some devices have not been polled in the last 5 minutes. You may have performance issues.
        [FIX]:
        Check your poll log and see: http://docs.librenms.org/Support/Performance/
        Devices:
         192.168.2.71
[FAIL]  Discovery has not completed in the last 24 hours.
        [FIX]:
        Check the cron job to make sure it is running and using discovery-wrapper.py
[WARN]  IPv6 is disabled on your server, you will not be able to add IPv6 devices.
[WARN]  Your install is over 24 hours out of date, last update: Fri, 01 Mar 2019 00:00:01 +0000
        [FIX]:
        Make sure your daily.sh cron is running and run ./daily.sh by hand to see if there are any errors.
[FAIL]  We have found some files that are owned by a different user than librenms, this will stop you updating automatically and / or rrd files being updated causing graphs to fail.
        [FIX]:
        sudo chown -R librenms:librenms /opt/librenms
        sudo setfacl -d -m g::rwx /opt/librenms/rrd /opt/librenms/logs /opt/librenms/bootstrap/cache/ /opt/librenms/storage/
        sudo chmod -R ug=rwX /opt/librenms/rrd /opt/librenms/logs /opt/librenms/bootstrap/cache/ /opt/librenms/storage/
        Files:
         /opt/librenms/cache/os_defs.cache
seems like it’s not new :
opened 12:09AM - 20 Mar 17 UTC
closed 06:57PM - 08 May 17 UTC
Needs-Info
Hi Folks,
if I enable
```
$config['rrdcached'] = "unix:/var/run/rrdcache… d.sock";
$config['rrdtool_version'] = '1.6.0';
```
everything works smoothly beside the graphs for the MySQL Application.
```
RRDTool Command
rrdtool graph /tmp/uYwinQJWxSQgZGpv --alt-autoscale-max --rigid -E --start 1489880700 --end 1489967100 --width 2124 --height 983.5 -c BACK#EEEEEE00 -c SHADEA#EEEEEE00 -c SHADEB#EEEEEE00 -c FONT#000000 -c CANVAS#FFFFFF00 -c GRID#a5a5a5 -c MGRID#FF9999 -c FRAME#5e5e5e -c ARROW#5e5e5e -R normal --font LEGEND:8:DejaVuSansMono --font AXIS:7:DejaVuSansMono --font-render-mode normal --alt-autoscale-max --rigid -E --start 1489880700 --end 1489967100 --width 2124 --height 983.5 -c BACK#EEEEEE00 -c SHADEA#EEEEEE00 -c SHADEB#EEEEEE00 -c FONT#000000 -c CANVAS#FFFFFF00 -c GRID#a5a5a5 -c MGRID#FF9999 -c FRAME#5e5e5e -c ARROW#5e5e5e -R normal --font LEGEND:8:DejaVuSansMono --font AXIS:7:DejaVuSansMono --font-render-mode normal COMMENT:'Connections Now Min Max Avg\l' DEF:ds0=/opt/librenms/rrd/thor-odd.f1-online.net/app-mysql-43.rrd:MaCs:AVERAGE DEF:ds0min=/opt/librenms/rrd/thor-odd.f1-online.net/app-mysql-43.rrd:MaCs:MIN DEF:ds0max=/opt/librenms/rrd/thor-odd.f1-online.net/app-mysql-43.rrd:MaCs:MAX DEF:ds1=/opt/librenms/rrd/thor-odd.f1-online.net/app-mysql-43.rrd:MUCs:AVERAGE DEF:ds1min=/opt/librenms/rrd/thor-odd.f1-online.net/app-mysql-43.rrd:MUCs:MIN DEF:ds1max=/opt/librenms/rrd/thor-odd.f1-online.net/app-mysql-43.rrd:MUCs:MAX DEF:ds2=/opt/librenms/rrd/thor-odd.f1-online.net/app-mysql-43.rrd:ACs:AVERAGE DEF:ds2min=/opt/librenms/rrd/thor-odd.f1-online.net/app-mysql-43.rrd:ACs:MIN DEF:ds2max=/opt/librenms/rrd/thor-odd.f1-online.net/app-mysql-43.rrd:ACs:MAX DEF:ds3=/opt/librenms/rrd/thor-odd.f1-online.net/app-mysql-43.rrd:AdCs:AVERAGE DEF:ds3min=/opt/librenms/rrd/thor-odd.f1-online.net/app-mysql-43.rrd:AdCs:MIN DEF:ds3max=/opt/librenms/rrd/thor-odd.f1-online.net/app-mysql-43.rrd:AdCs:MAX DEF:ds4=/opt/librenms/rrd/thor-odd.f1-online.net/app-mysql-43.rrd:TCd:AVERAGE DEF:ds4min=/opt/librenms/rrd/thor-odd.f1-online.net/app-mysql-43.rrd:TCd:MIN DEF:ds4max=/opt/librenms/rrd/thor-odd.f1-online.net/app-mysql-43.rrd:TCd:MAX DEF:ds5=/opt/librenms/rrd/thor-odd.f1-online.net/app-mysql-43.rrd:Cs:AVERAGE DEF:ds5min=/opt/librenms/rrd/thor-odd.f1-online.net/app-mysql-43.rrd:Cs:MIN DEF:ds5max=/opt/librenms/rrd/thor-odd.f1-online.net/app-mysql-43.rrd:Cs:MAX LINE1.25:ds0#CC0000:'Max Connection ' GPRINT:ds0:LAST:%5.2lf%s GPRINT:ds0min:MIN:%5.2lf%s GPRINT:ds0max:MAX:%5.2lf%s GPRINT:ds0:AVERAGE:'%5.2lf%s\n' LINE1.25:ds1#008C00:'Max Used Conne ' GPRINT:ds1:LAST:%5.2lf%s GPRINT:ds1min:MIN:%5.2lf%s GPRINT:ds1max:MAX:%5.2lf%s GPRINT:ds1:AVERAGE:'%5.2lf%s\n' LINE1.25:ds2#4096EE:'Aborted Client ' GPRINT:ds2:LAST:%5.2lf%s GPRINT:ds2min:MIN:%5.2lf%s GPRINT:ds2max:MAX:%5.2lf%s GPRINT:ds2:AVERAGE:'%5.2lf%s\n' LINE1.25:ds3#73880A:'Aborted Connec ' GPRINT:ds3:LAST:%5.2lf%s GPRINT:ds3min:MIN:%5.2lf%s GPRINT:ds3max:MAX:%5.2lf%s GPRINT:ds3:AVERAGE:'%5.2lf%s\n' LINE1.25:ds4#D01F3C:'Threads Connec ' GPRINT:ds4:LAST:%5.2lf%s GPRINT:ds4min:MIN:%5.2lf%s GPRINT:ds4max:MAX:%5.2lf%s GPRINT:ds4:AVERAGE:'%5.2lf%s\n' LINE1.25:ds5#36393D:'New Connection ' GPRINT:ds5:LAST:%5.2lf%s GPRINT:ds5min:MIN:%5.2lf%s GPRINT:ds5max:MAX:%5.2lf%s GPRINT:ds5:AVERAGE:'%5.2lf%s\n' HRULE:0#555555 --imgformat=SVG
RRDTool Output
ERROR: rrdc_fetch: Got 47 lines, expected 1447
```
Any ideas how to drill down on this?
Thanks,
Wolfgang
==========================================================
Component | Version
--------- | -------
LibreNMS | 12b45f356ea6d642f045f538d47ed7b592e9a3a7
DB Schema | 177
PHP | 7.0.16-3
MySQL | 10.2.4-MariaDB-10.2.4+maria~sid-log
RRDTool | 1.6.0
SNMP | NET-SNMP 5.7.3
==========================================================
DO NOT DELETE THIS INFORMATION.
> Please read this information carefully.
GitHub issues is for bugs, please do not post issues asking for help or how to do X, Y or Z.
You can use our irc channel ##librenms on freenode to ask questions or our [community site](https://community.librenms.org).
If you have a feature request please post this on our [community site](https://community.librenms.org/c/feature-requests).
Please confirm each of the sections below by putting an `x` in the box like `[x]`.
- [ x] Is your install up to date? [Updating your install](http://docs.librenms.org/General/Updating/)
Please do not submit an issue if your install is not up to date within the last 24 hours or on a stable monthly release.
- [ x] Please include all of the information between the `====================================` section of `./validate.php` which you can run from the cli.
- [x ] Please provide ALL info asked for [here](http://docs.librenms.org/Support/FAQ/#faq20).
- [x ] Please provide as much detail as possible.
- [x ] Please do NOT post more than 10 lines of debug information here, use a pastebin service or GitHub Gists.
what can i do ?
All the mysql servers I monitor draw all graphs correctly.
Check the output of the script/check the poller with ./poller.php -d -h affectedhostid -m applications for debug where the graph fails.
LibreNMS Poller
SQL[select `migration` from `migrations` order by `id` desc limit 1 [] 784.85ms]

SQL[select count(*) as aggregate from `migrations` limit 1 [] 21.42ms]

SQL[SELECT version() [] 0.31ms]

===================================
Version info:
Commit SHA: 3ad698ff98eaca99a63238a4ec2ab35c7b67541c
Commit Date: 1551398401
DB Schema: 2019_02_10_220000_add_dates_to_fdb (132)
PHP: 7.2.15-1+0~20190209065123.16+stretch~1.gbp3ad8c0
MySQL: 5.7.24-27
RRDTool: 1.6.0
SNMP: NET-SNMP 5.7.3
==================================DEBUG!
Updating os_def.cache...
Done
Override poller modules: applications
Starting polling run:

SQL[SELECT * FROM `devices` WHERE `disabled` = 0 AND `hostname` = 'affectedhostid' ORDER BY `device_id` ASC [] 0.92ms]

./poller.php affectedhostid 2019-03-05 13:00:46 - 0 devices polled in 4.688 secs
MySQL [1/0.00s]: Cell[1/0.00s] Row[-1/-0.00s] Rows[1/0.00s] Column[0/0.00s] Update[0/0.00s] Insert[0/0.00s] Delete[0/0.00s]
here
I know this had nothing to do with MySQL app but you need to fix those fails and warns in your validate
====================================
Component | Version
--------- | -------
LibreNMS  | 1.48.1-90-g3ad698ff9
DB Schema | 2019_02_10_220000_add_dates_to_fdb (132)
PHP       | 7.2.15-1+0~20190209065123.16+stretch~1.gbp3ad8c0
MySQL     | 5.7.24-27
RRDTool   | 1.6.0
SNMP      | NET-SNMP 5.7.3
====================================

[OK]    Composer Version: 1.8.4
[OK]    Dependencies up-to-date.
[OK]    Database connection successful
[OK]    Database schema correct
[FAIL]  Discovery has not completed in the last 24 hours.
        [FIX]:
        Check the cron job to make sure it is running and using discovery-wrapper.py
[WARN]  IPv6 is disabled on your server, you will not be able to add IPv6 devices.
[WARN]  Your install is over 24 hours out of date, last update: Fri, 01 Mar 2019 00:00:01 +0000
        [FIX]:
        Make sure your daily.sh cron is running and run ./daily.sh by hand to see if there are any errors.
i guess it’s ok like that ?
Change affectedhostid with a read device id
please need help, sorry for reposting
@Sabrimjd It looks like the poller is picking up your MySQL application and updating the database as it should. My guess as to why you aren’t seeing older graphs is because your cron job for the poller isn’t working properly.
From your validate.php output:
Hello i dont understand, my crons are working good
Sorry, somehow I was not getting notified about this topic.
Everything seems to be running correctly but some warning about discovery, but your mysql graphs are not populating correctly.
Are you up to date? I think someone fixed recently a graph that were not working properly #9910
Im having same issue:
====================================
Component | Version
--------- | -------
LibreNMS  | 1.49-117-g649db31ef
DB Schema | 2019_02_10_220000_add_dates_to_fdb (132)
PHP       | 7.2.16-1+0~20190307202415.17+stretch~1.gbpa7be82
MySQL     | 10.1.26-MariaDB-0+deb9u1
RRDTool   | 1.6.0
SNMP      | NET-SNMP 5.7.3
====================================

[OK]    Composer Version: 1.8.4
[OK]    Dependencies up-to-date.
[OK]    Database connection successful
[OK]    Database schema correct
Actually the problem is only with Mysql, because i have nginx/postfix/memcached apps working fine.
The only error i see:
RRDTool Output

ERROR: rrdc_fetch: Got 147 lines, expected 295
Thanks.
Exactly the same, i can see the graph if i dont zoom btw.
I have now disabled rrdcached and mysql graphs work again
#$config['rrdcached'] = "unix:/var/run/rrdcached.sock";
#$config['rrdtool_version'] = "1.6.0";
Do you can test this?
I have just started using the mysql application and am also seeing this issue.