I used to read the device_perf tables using a MariaDB GUI and used database joins with the other Libre device tables to create information rich reports and deep analysis of various performance issues on our network terminals. It was very powerful and useful.
Are you able to advise the best way I can achieve the same functionality using RRD?
Hey @PeterM, sorry to hear that. The device_perf table was removed because it was consistently breaking user’s installs with data that should have been in time series (RRD) storage in the first place.
We don’t know what kind of analysis you are doing, so my advice will be very generic.
You can also have LibreNMS push data to something like InfluxDB, which is much better suited to add nice analysis on top of. InfluxDBv2 - LibreNMS Docs
Thanks for the response I will take a look at the RRDTool.
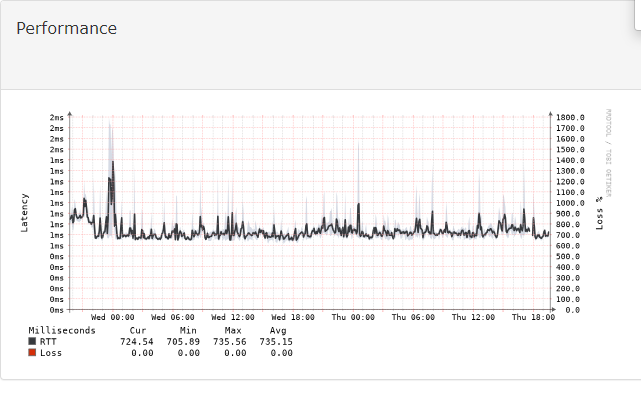
Can you please check how your new latency charts are working. I notice that the scale on the right hand side Y axis that presents % Loss follows the scale on the left hand y-axis and it is giving the wrong presentation of % Loss results. You should set it up so that % loss is a fixed Y-Axis from 0 to 100%. Take a look at this example, you can not have 1800% Loss rate.